
Accounts Receivable Statistics
Discover the accounts receivable, payments, and automation trends businesses face, with data from original Versapay research. Work more efficiently by keeping a finger on the pulse.
Virtual credit card statistics (2024)
The following statistics (and emerging trends in virtual credit card technology) come from our study that combines findings from two separate surveys: 1) 200 finance leaders faced with the prospect of accepting virtual credit cards, and 2) 200 accounts payable leaders already using virtual credit cards to pay for invoices.
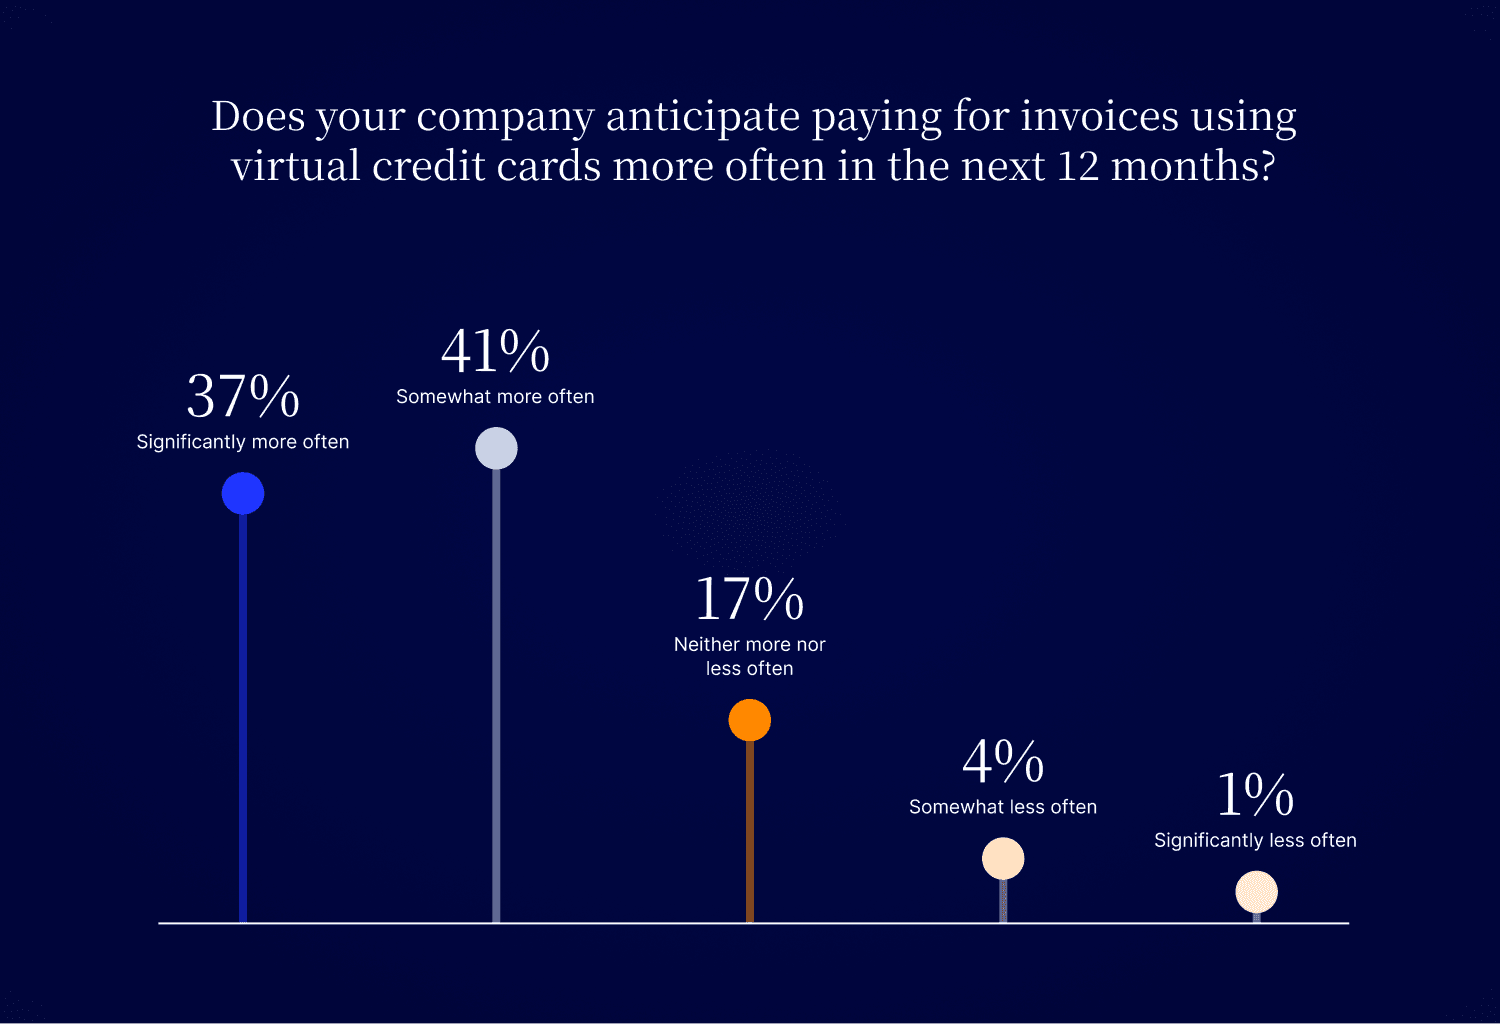
- More than three quarters of accounts payable leaders anticipate paying for invoices using virtual credit cards more often in the next 12 months.
37.13% — Significantly more often
39.52% — Somewhat more often
17.96% — Neither more nor less often
4.19% — Somewhat less often
1.2% — Significantly less often
Over half of accounts payable leaders have tried to pay for an invoice using a virtual credit card only for the seller to not accept that method.
52.10% — Yes
35.93% — No
11.98% — Unsure
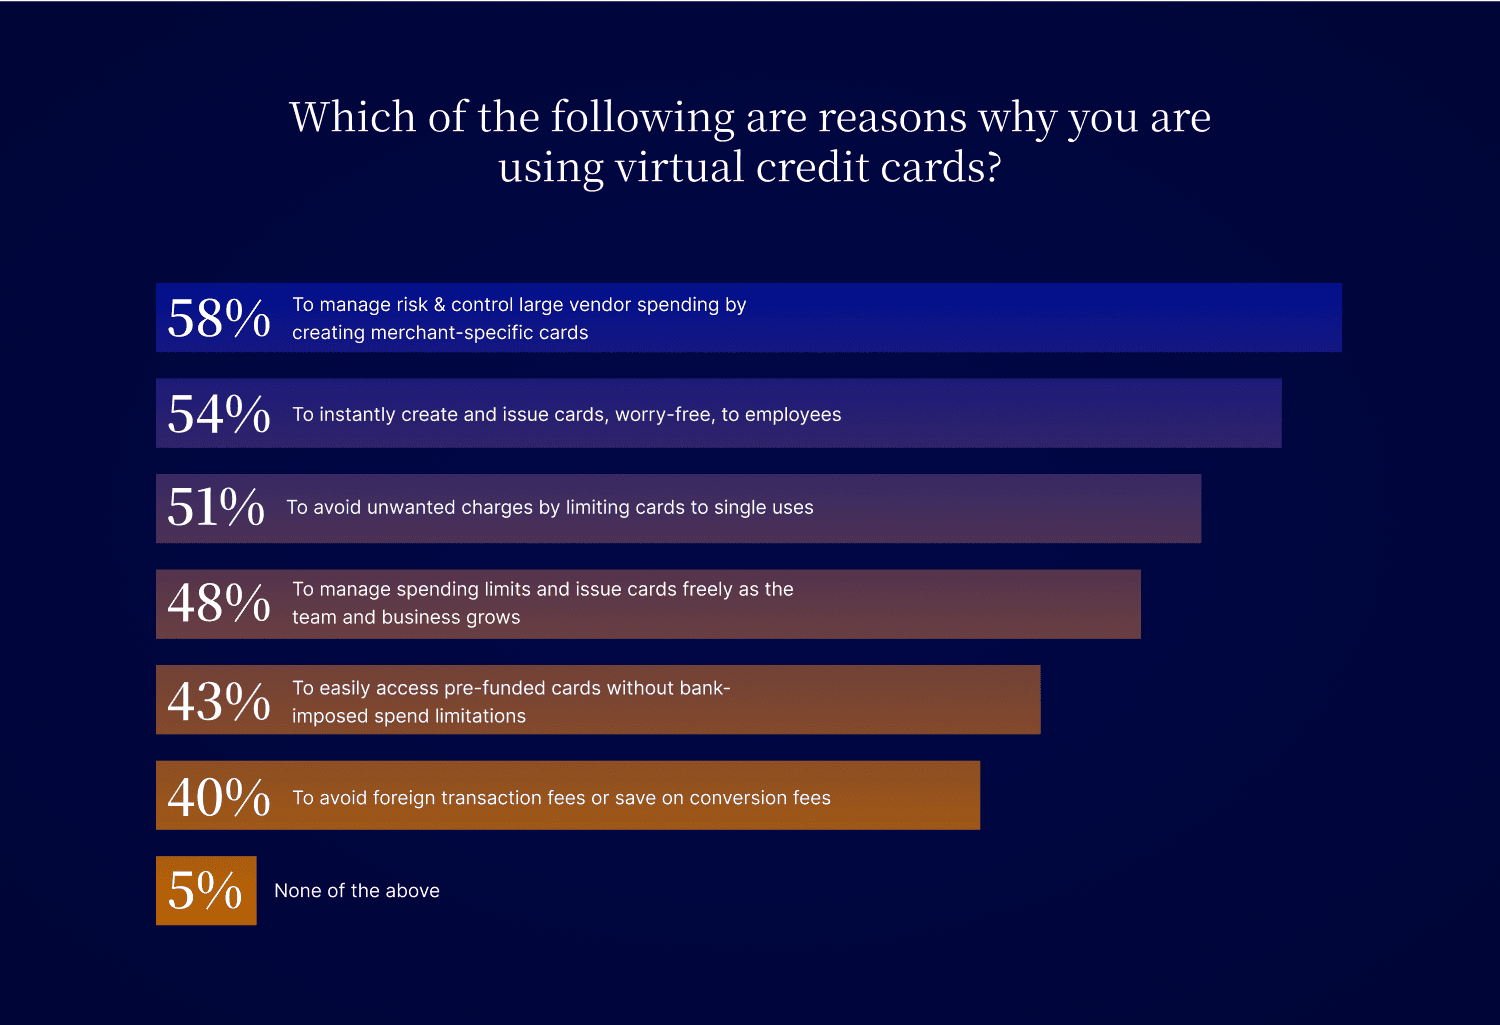
These are the following reasons why accounts payable leaders are using virtual credit cards.
53.89% — To instantly create and issue cards, worry-free, to employees
58.08% — To manage risk & control large vendor spending by creating merchant-specific cards
50.90% — To avoid unwanted charges by limiting cards to single uses
40.12% — To avoid foreign transaction fees or save on conversion fees
47.90% — To manage spending limits and issue cards freely as the team and business grows
43.11% — To easily access pre-funded cards without bank-imposed spend limitations
5.39% — None of the above
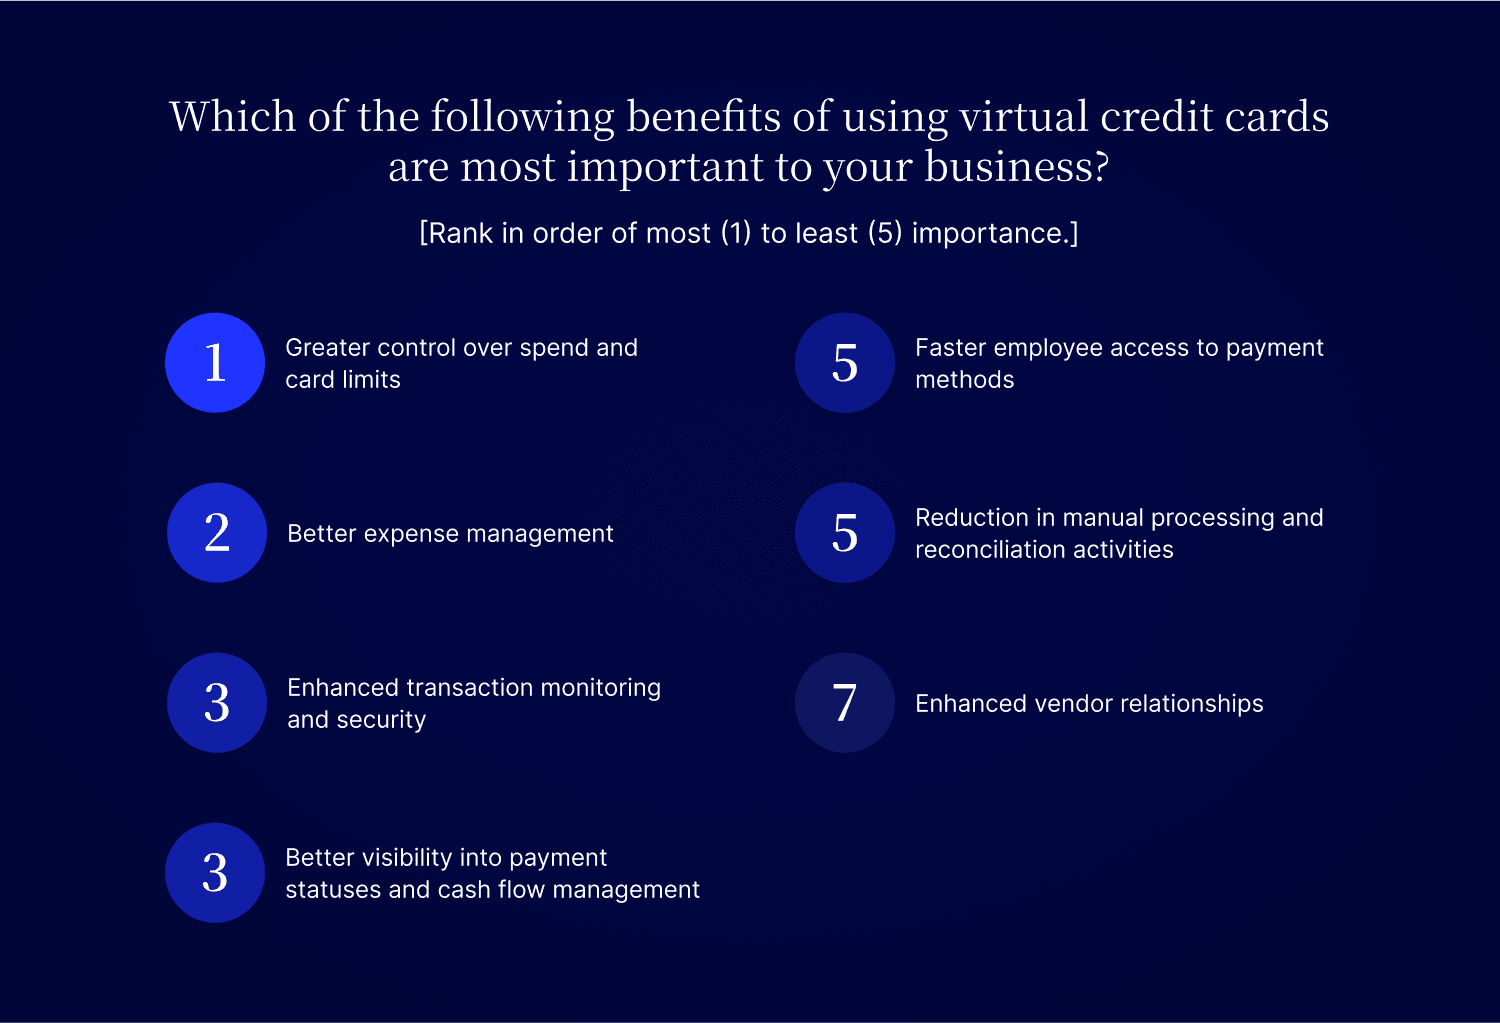
These are the benefits of using virtual credit cards that are most important to accounts payable leaders' businesses. [Rank in order of most (1) to least (5) importance.]
1 — Greater control over spend and card limits
2 — Better expense management
3 — Enhanced transaction monitoring and security
3 — Better visibility into payment statuses and cash flow management
5 — Faster employee access to payment methods
5 — Reduction in manual processing and reconciliation activities
7 — Enhanced vendor relationships
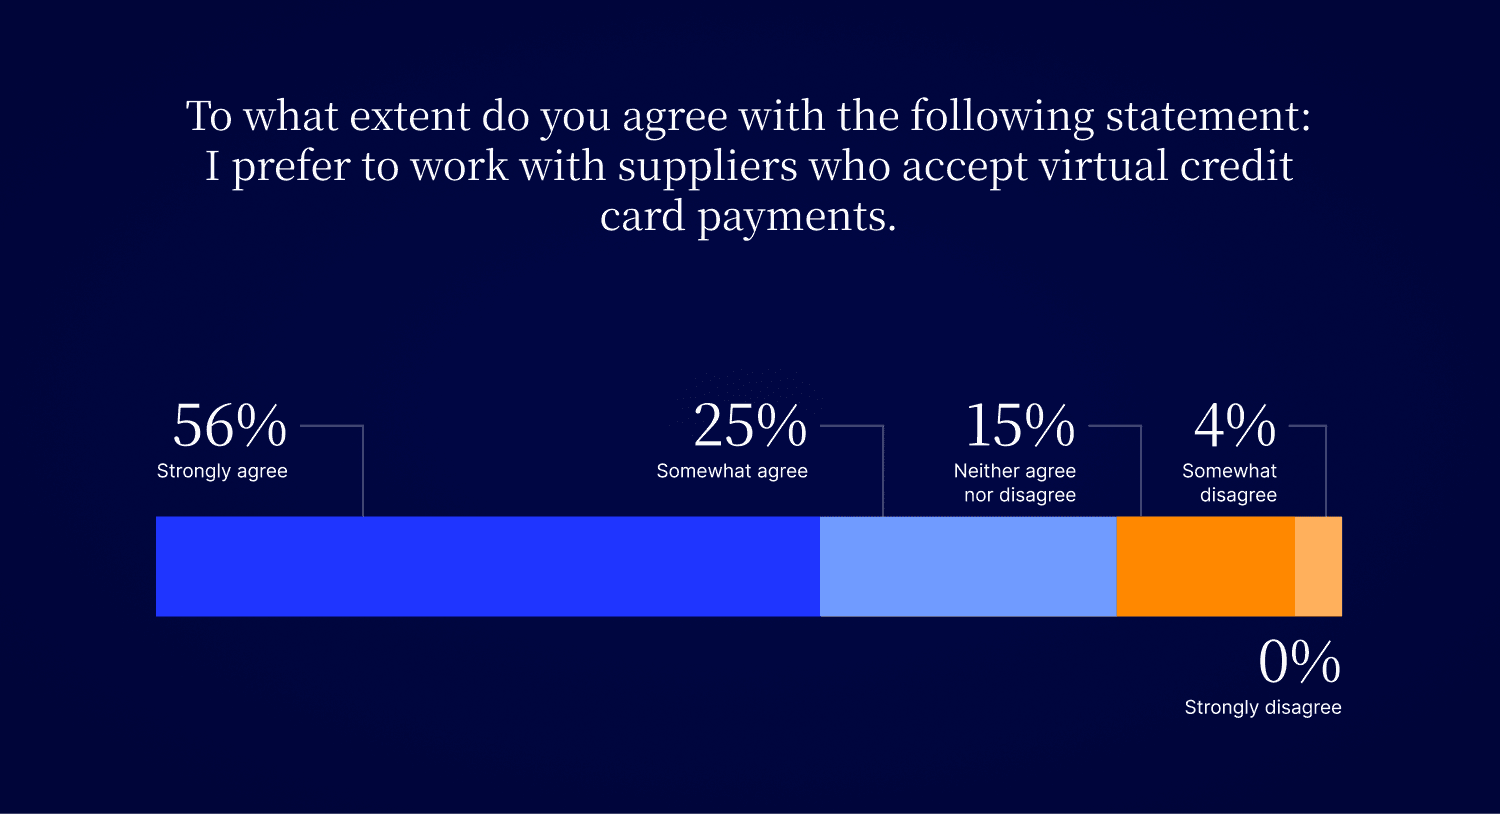
More than 80% of accounts payable leaders prefer working with suppliers who accept virtual credit card payments
55.69% — Strongly agree
25.15% — Somewhat agree
14.97% — Neither agree nor disagree
4.19% — Somewhat disagree
0.00% — Strongly disagree
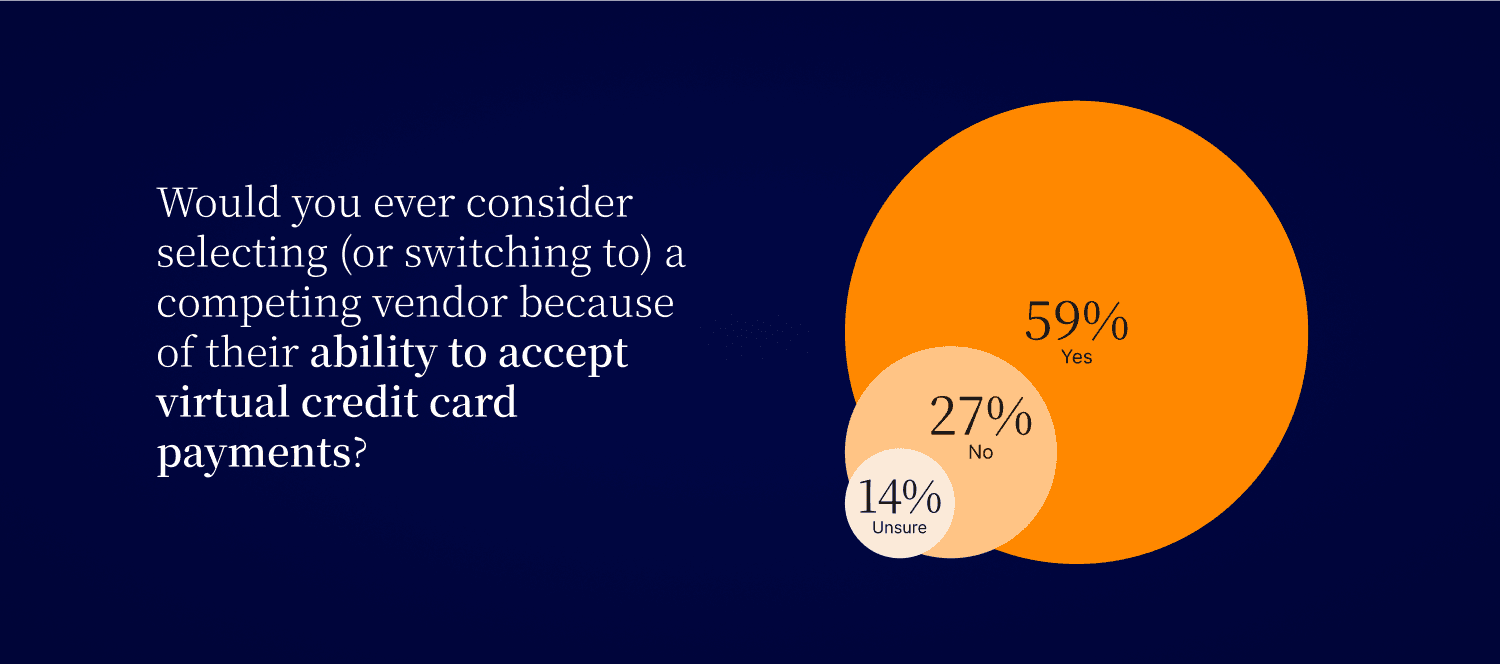
Over half of accounts payable leaders would ever consider selecting (or switching to) a competing vendor because of their ability to accept virtual credit card payments.
58.68% — Yes
26.95% — No
14.37% — Unsure
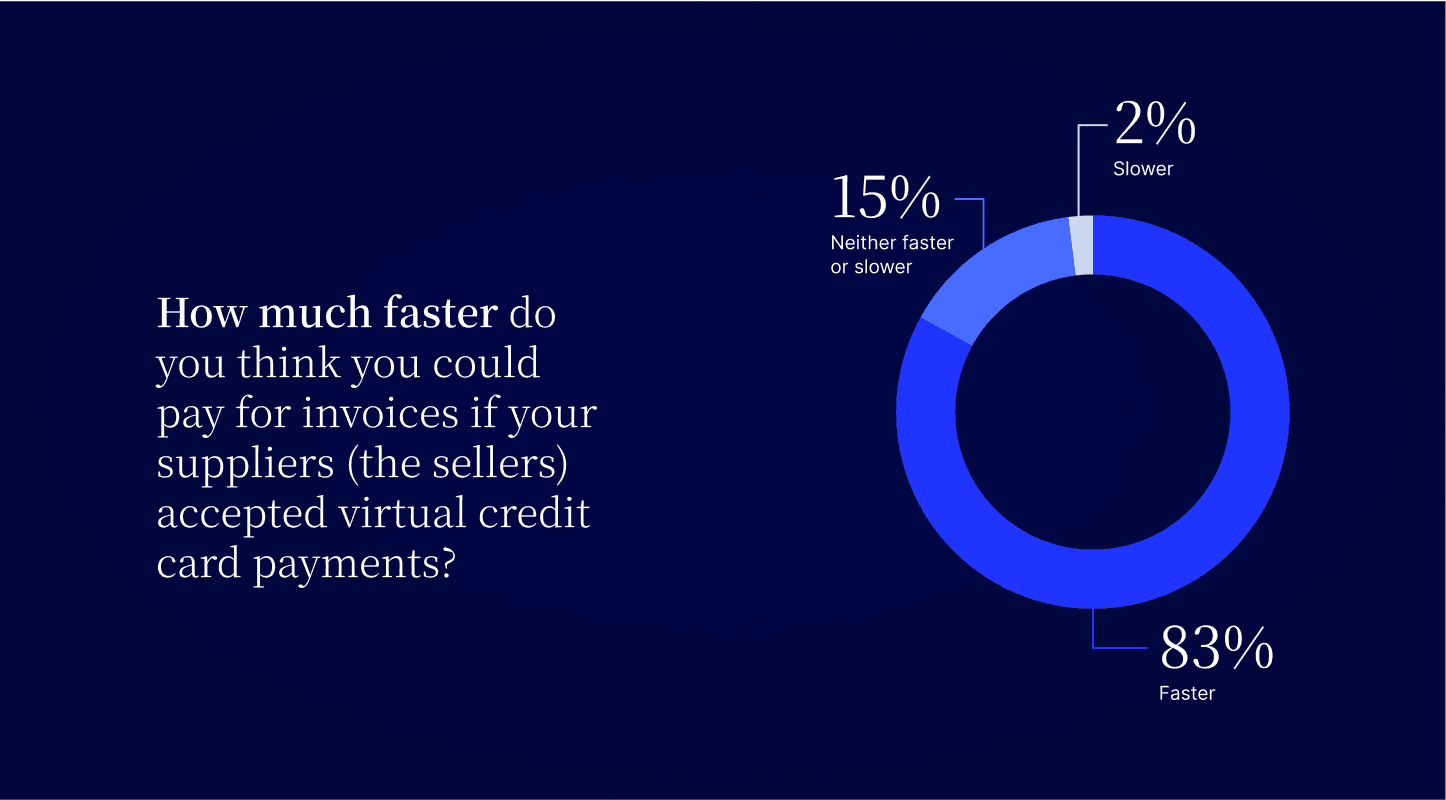
More than 80% of accounts payable leaders think they could pay for invoices faster if their suppliers accepted virtual credit card payments.
55.09% — Significantly faster
26.95% — Somewhat faster
15.57% — Neither faster or slower
1.20% — Somewhat slower
1.20% — Significantly slower
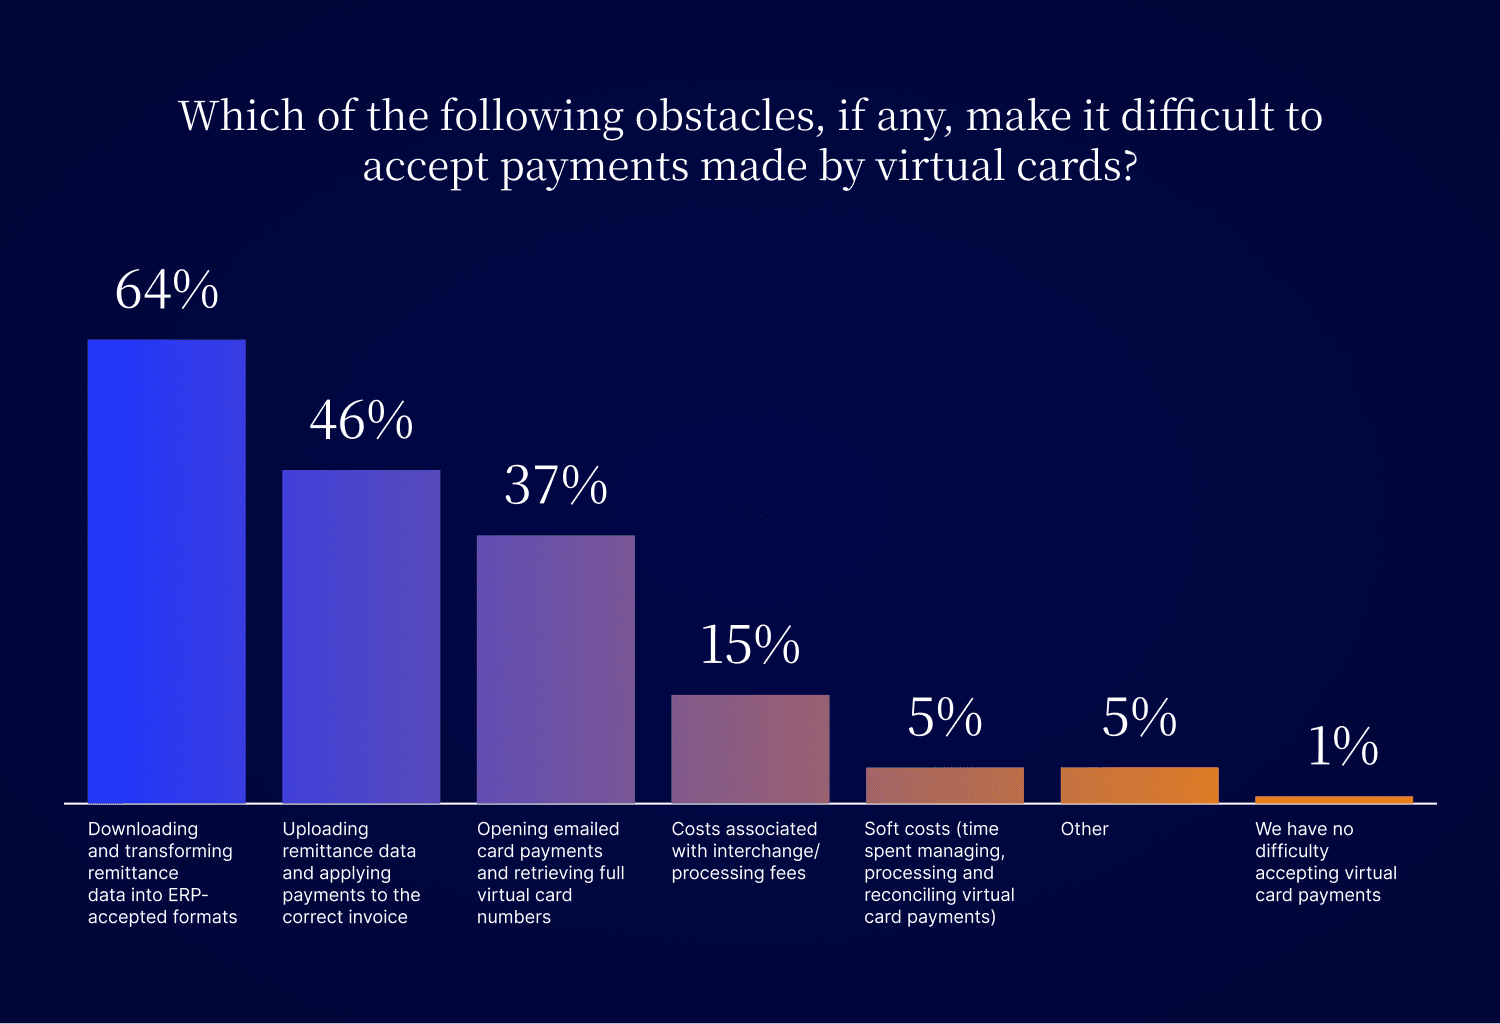
Three fifths of finance leaders report downloading and transforming remittance data into ERP-accepted formats as the biggest obstacle to accepting virtual card payments.
64% — Downloading and transforming remittance data into ERP-accepted formats
46% — Uploading remittance data and applying payments to the correct invoice
37% — Opening emailed card payments and retrieving full virtual card numbers
15% — Costs associated with interchange / processing fees
5% — Soft costs (time spent managing, processing and reconciling virtual card payments)
5% — Other
1% — We have no difficulty accepting virtual card payments
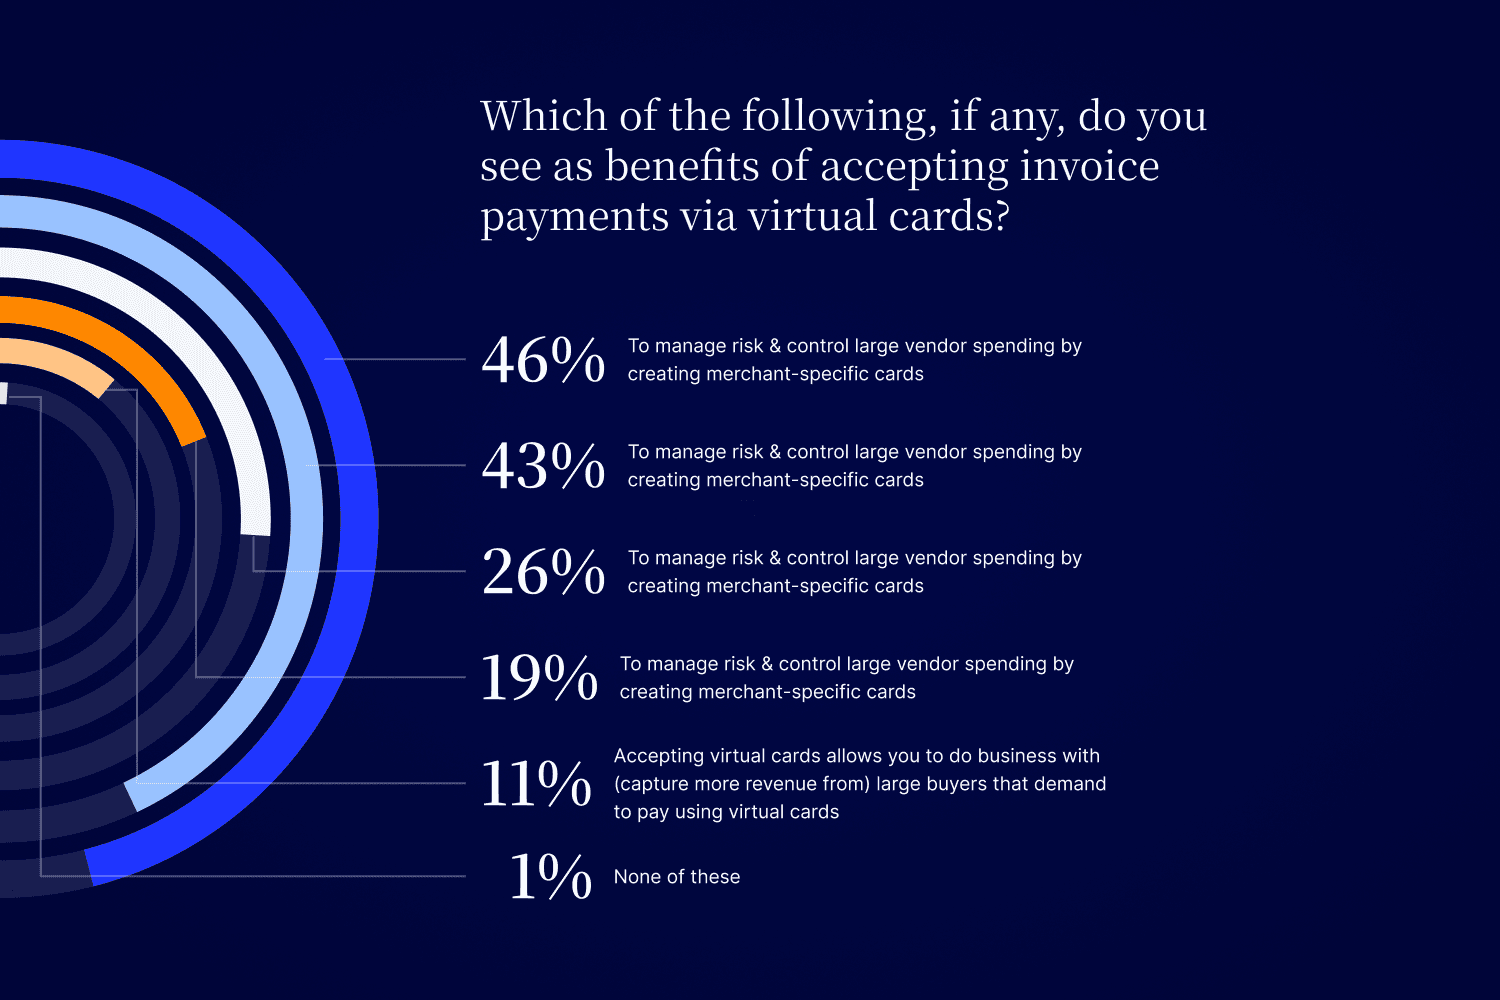
Nearly half of finance leaders think the potential for automatic reconciliation of virtual card payments with open accounts / invoices as the biggest benefit of accepting invoice payments via virtual credit cards.
46% — Virtual card payments can be automatically reconciled with open accounts / invoices
43% — Less reliance on paper checks when accepting virtual cards
26% — Accepting virtual cards allows you to meet your buyer’s payment preferences and deliver better customer experiences
19% — Minimized exposure to fraud risk when accepting virtual cards
11% — Accepting virtual cards allows you to do business with (capture more revenue from) large buyers that demand to pay using virtual cards
1% — None of these
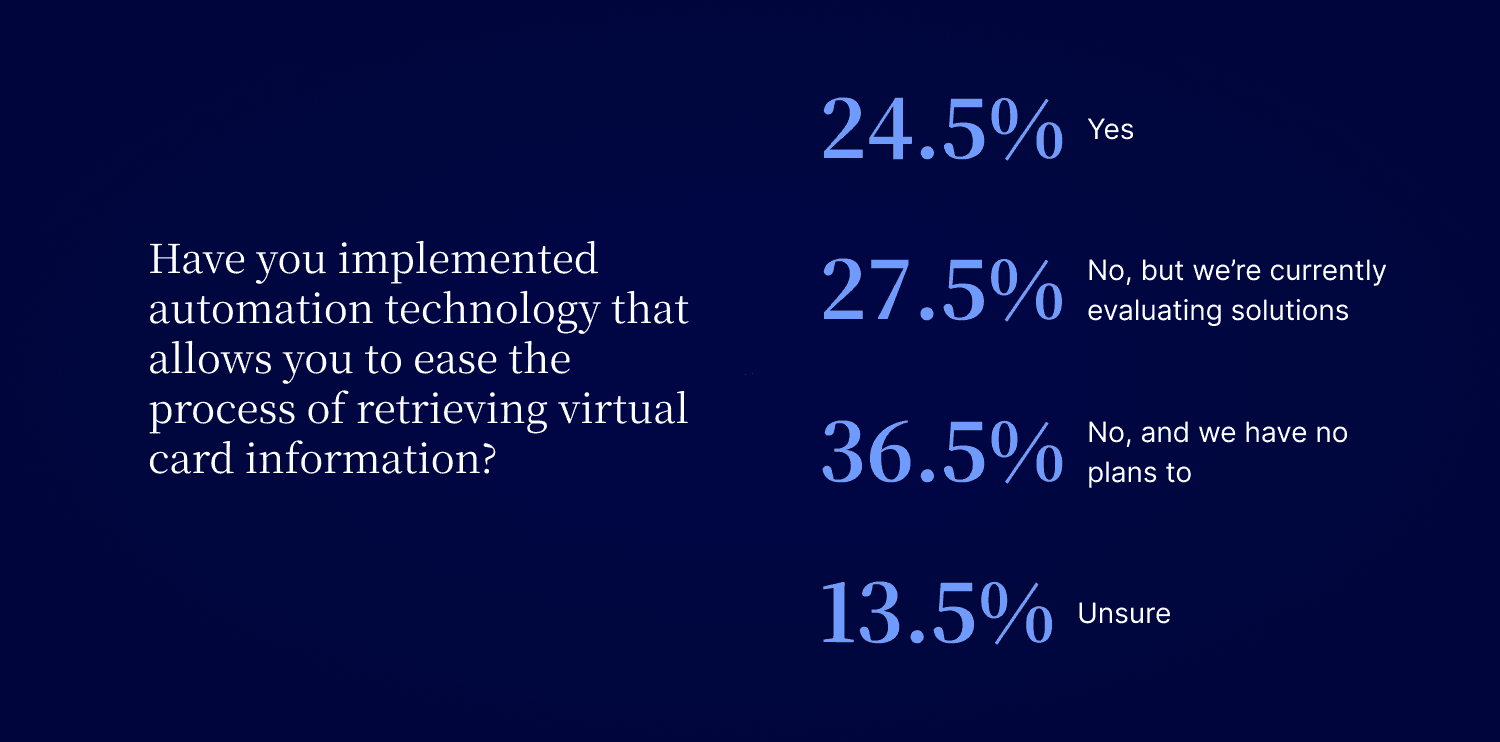
Less than a quarter of finance leaders have implemented automation technology that allows them to ease the process of retrieving virtual card information.
24.50% — Yes
27.50% — No, but we’re currently evaluating solutions
36.50% — No, and we have no plans to
11.50% — Unsure
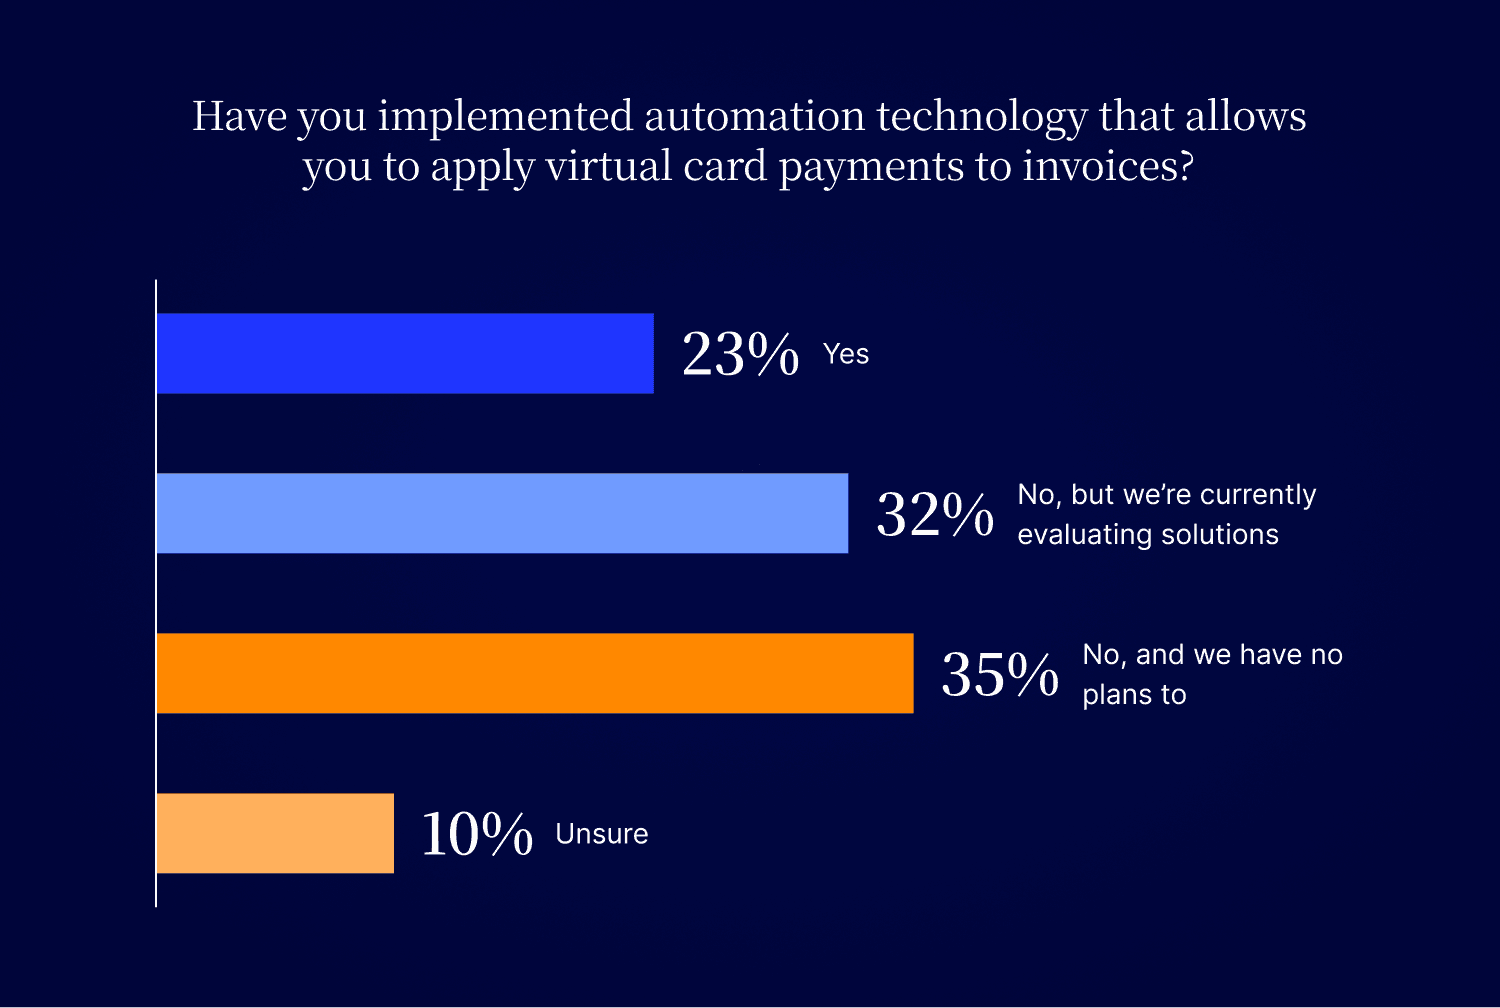
Less than a quarter of finance leaders have implemented automation technology that allows them to apply virtual card payments to invoices.
23% — Yes
32% — No, but we’re currently evaluating solutions
34.50% — No, and we have no plans to
10.50% — Unsure
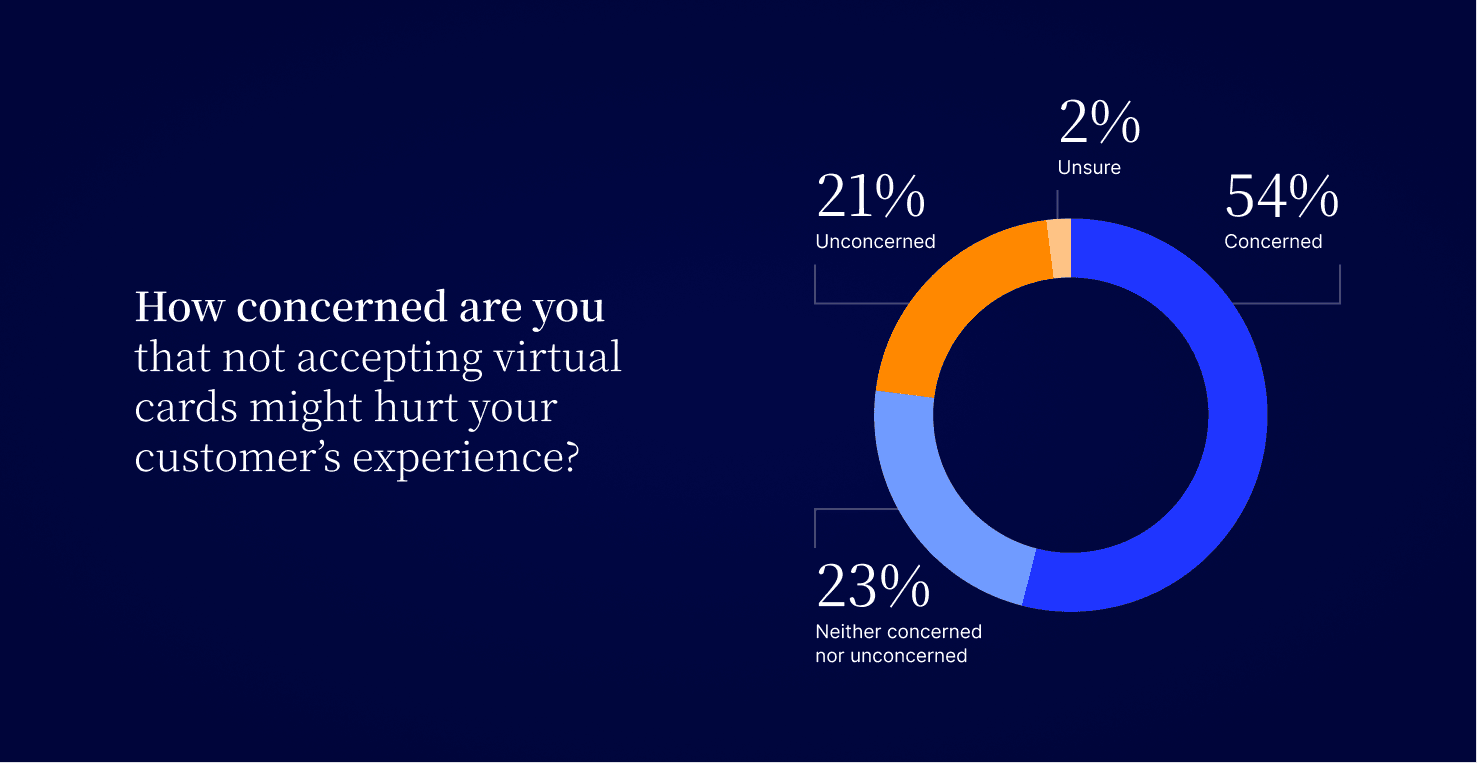
Over half of finance leaders are concerned that not accepting virtual credit cards might hurt their overall customer experience and subsequently make doing business with them less enjoyable.
54% — Concerned
23% — Neither concerned or unconcerned
21% — Unconcerned
2% — Unsure
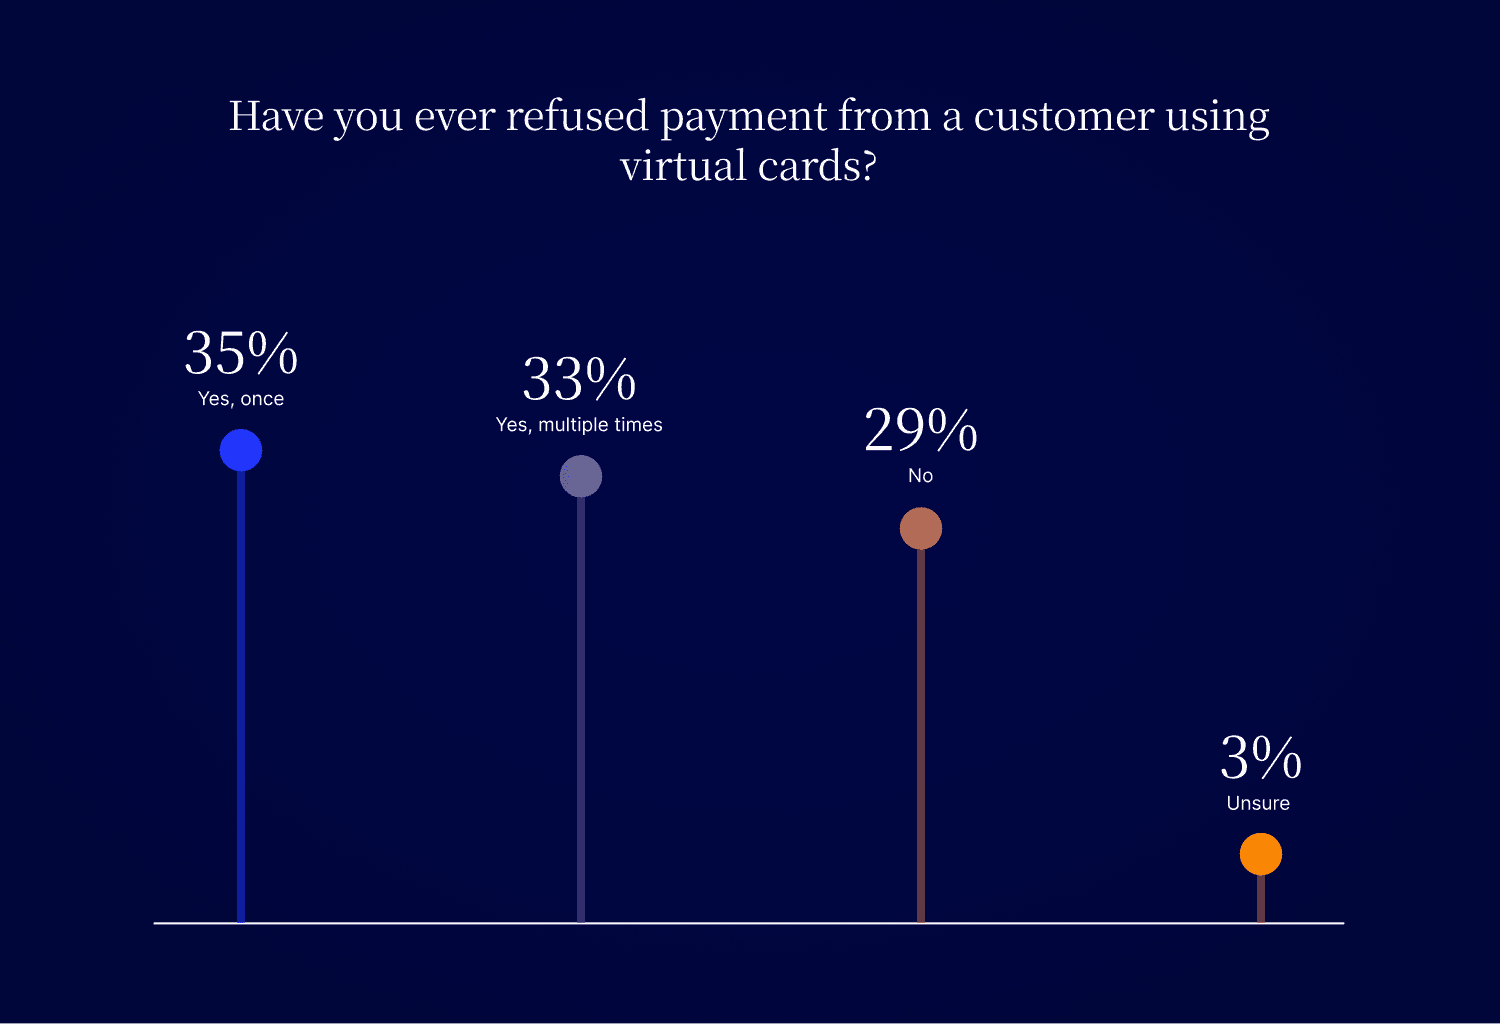
More than two thirds of finance leaders have refused a virtual credit card payment.
34.50% — Yes, once
33% — Yes, multiple times
29% — No
3.50% — Unsure
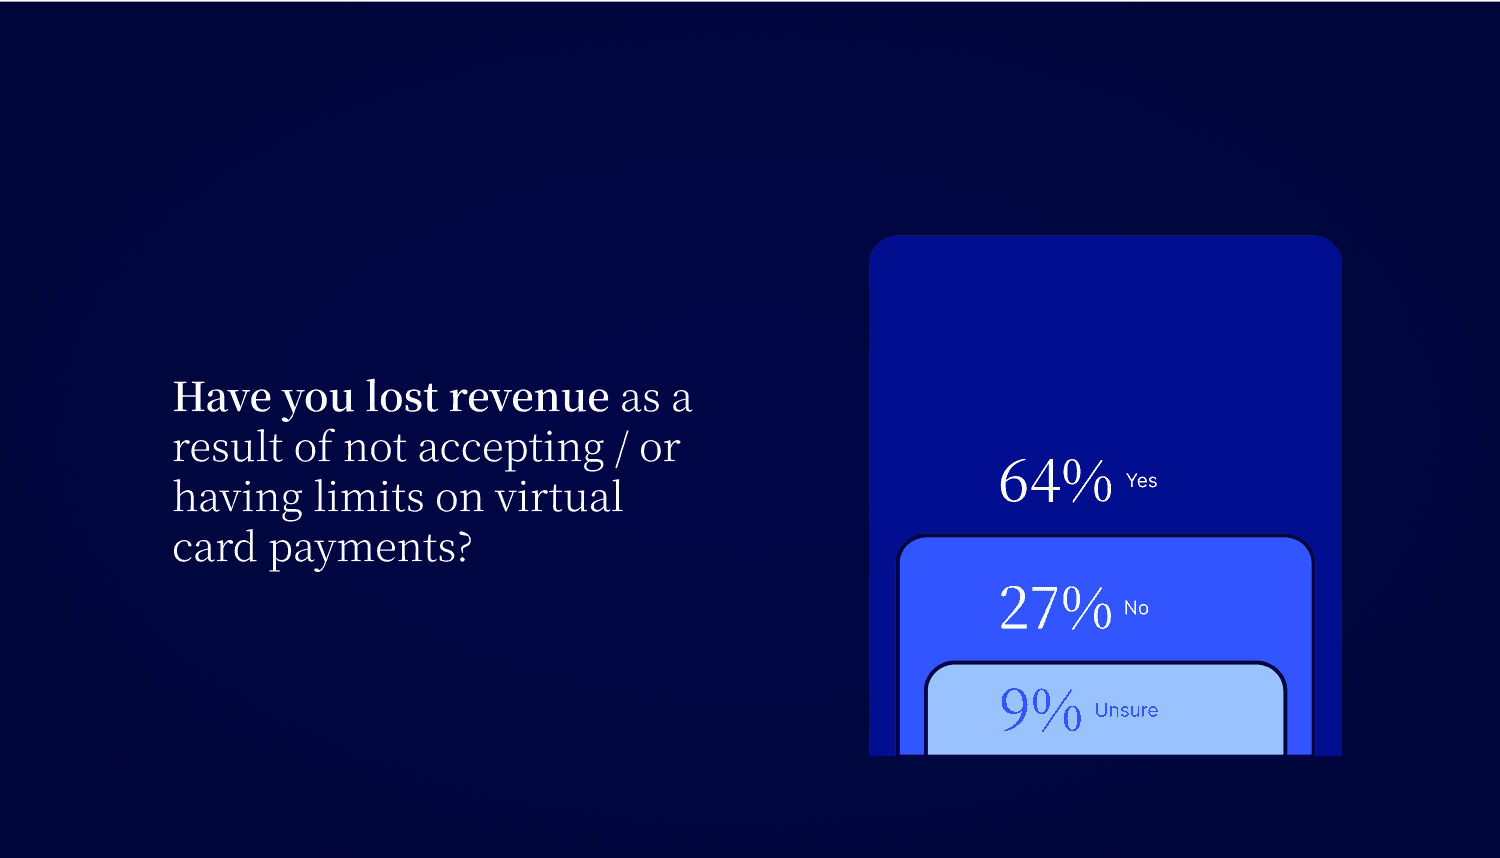
More than three fifths of finance leaders have lost revenue as a result of not accepting or having limits on virtual card payments.
38.50% — Yes, once
25% — Yes, multiple times
27% — No
9.50% — Unsure
How Accepting Virtual Credit Cards Can Save Your Business
Cash application statistics (2024)
Versapay commissioned Forrester Consulting to conduct a Total Economic Impact™ (TEI) study and examine the potential return on investment (ROI) enterprises may realize by deploying Versapay Cash Application. The purpose of this study is to provide readers with a framework to evaluate the potential financial impact of Cash Application on their organizations.
To better understand the benefits, costs, and risks associated with this investment, Forrester interviewed four representatives with experience using Versapay Cash Application. For the purposes of this study, Forrester aggregated the interviewees’ experiences and combined the results into a single composite organization that is an organization specializing in custom fabrication and distribution with a strong online presence, 15 national retail stores, and revenue of $300 million per year
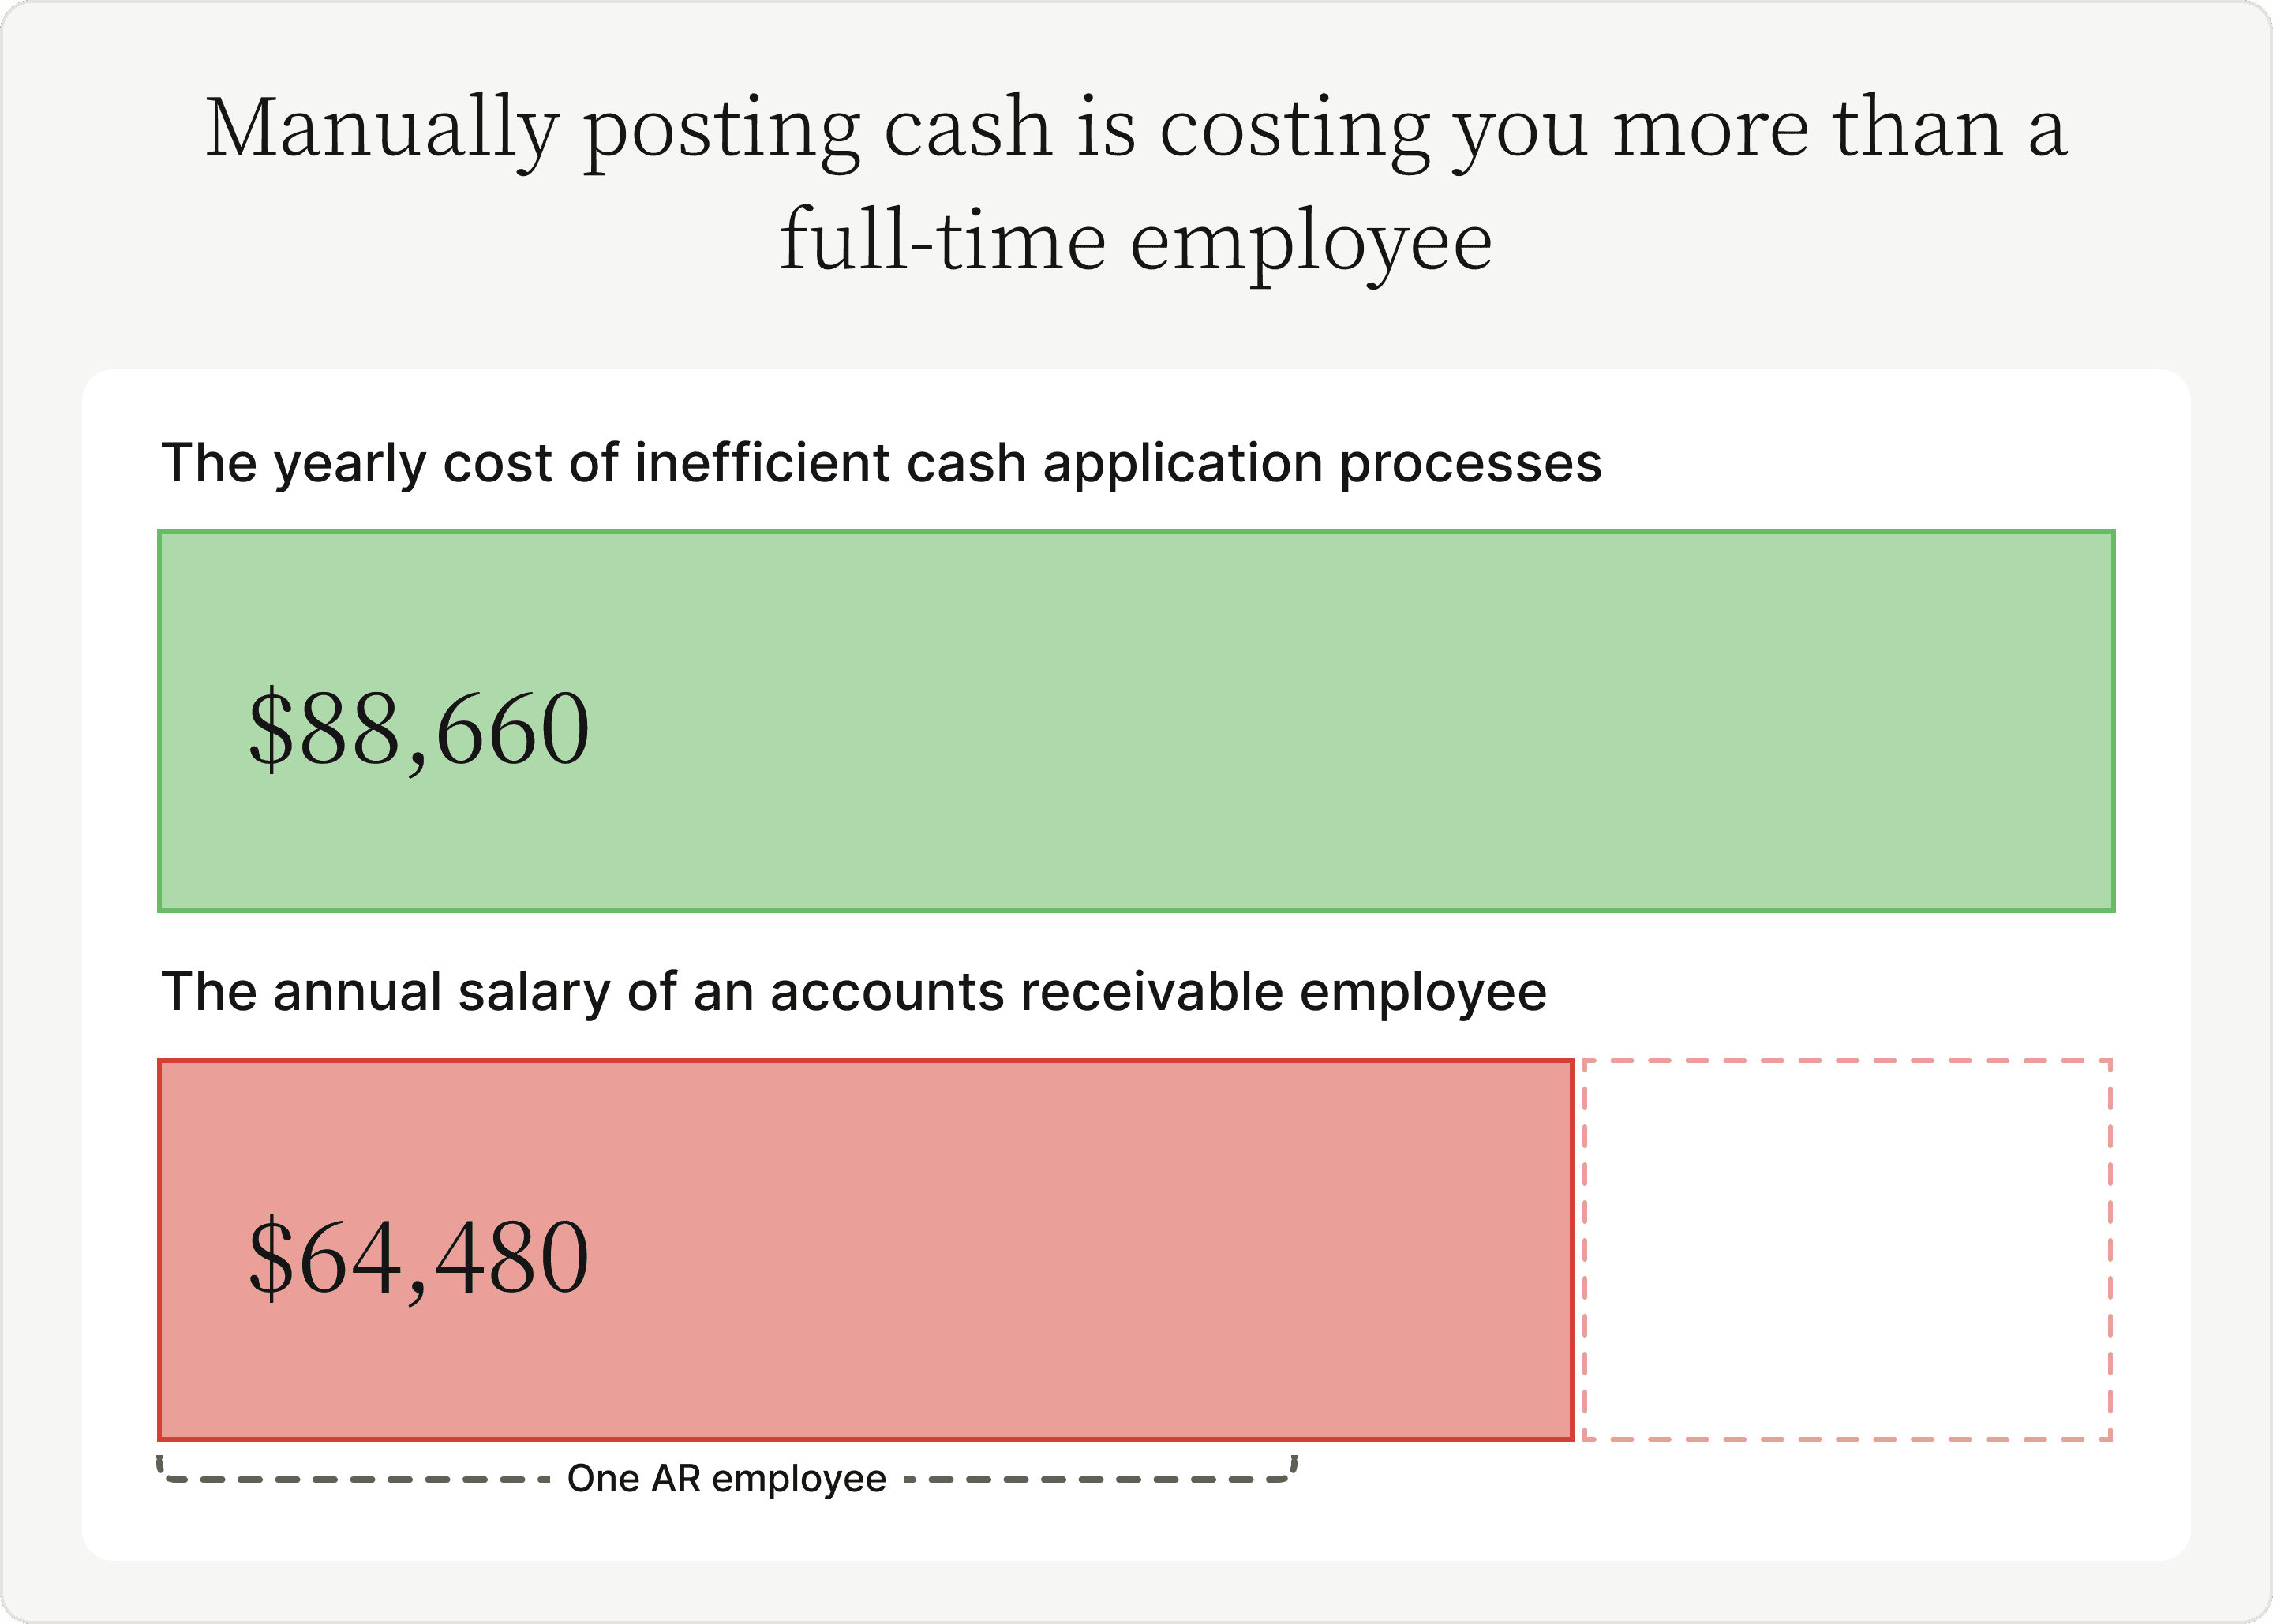
- Forrester's study demonstrates that the composite organization, on average, spends 16 hours posting cash manually, daily. In other words, manually posting cash is costing the composite organization $88,660 yearly, more than a full-time employee.
- Forrester's study demonstrates how the composite organization spends almost $90,000 annually on interest caused by inaccurate and delayed cash posting. These interest costs occur due to lengthy DSO times creating working capital holes forcing companies to seek external financing.

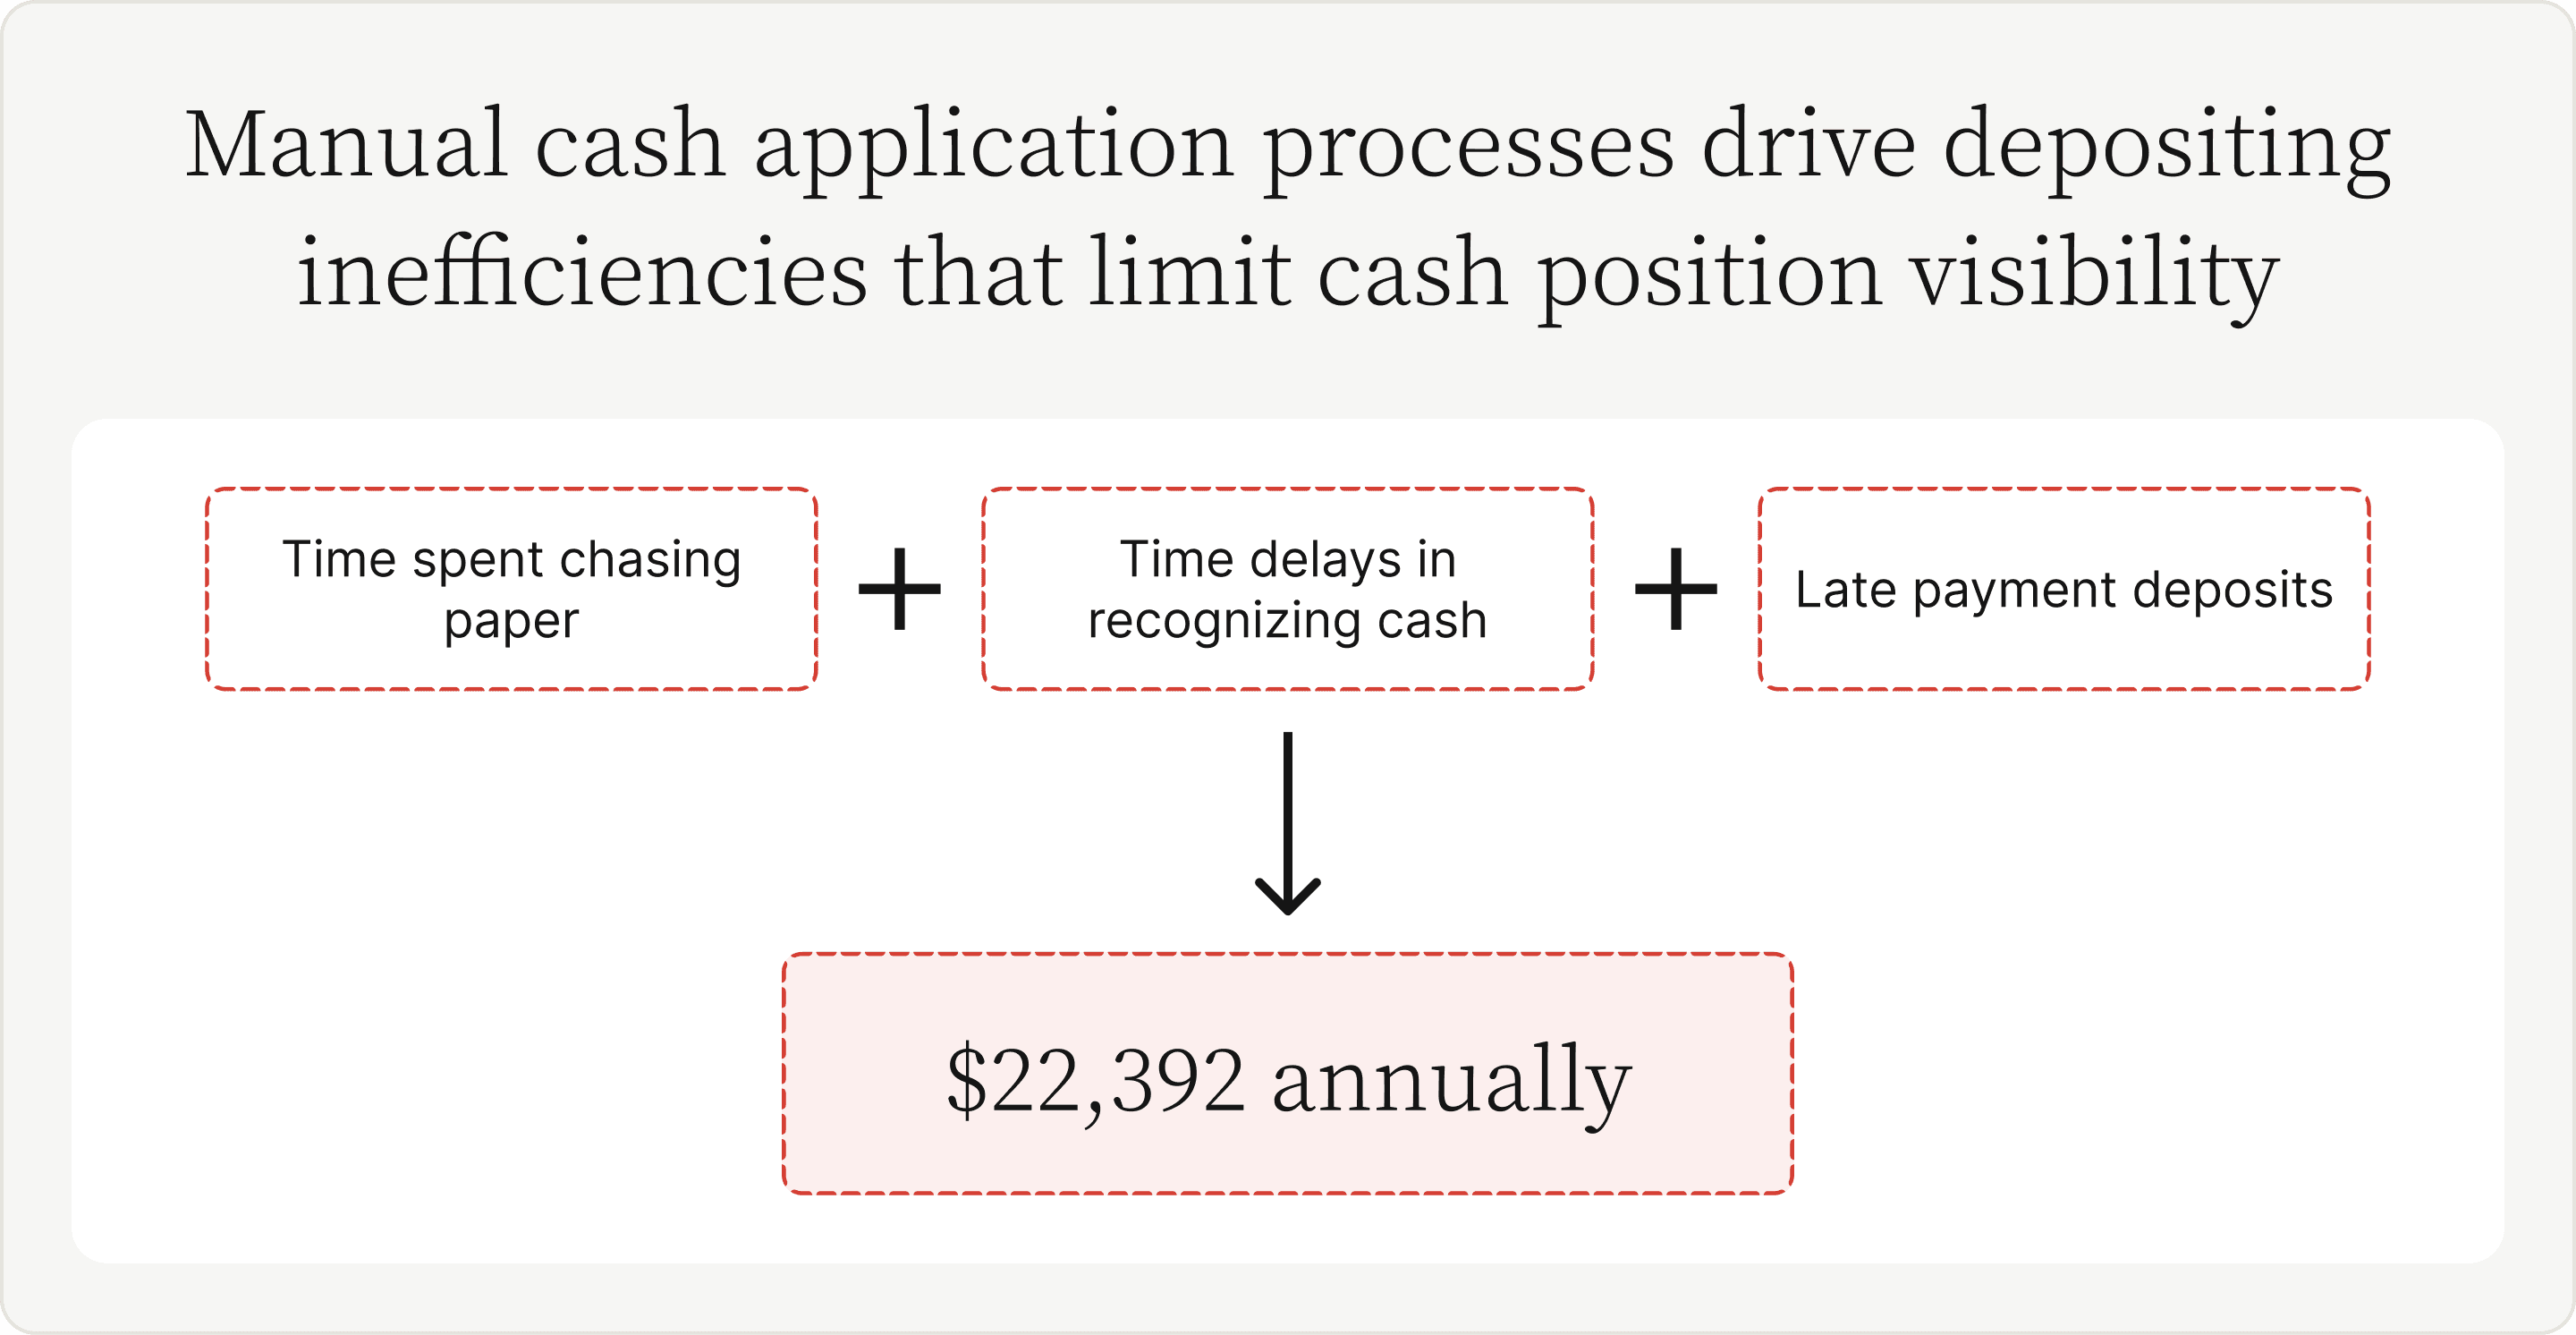
- For the composite organization, Forrester's study demonstrates how manual cash application processes that drive depositing inefficiencies which limit cash position visibility cost $22,392 annually.
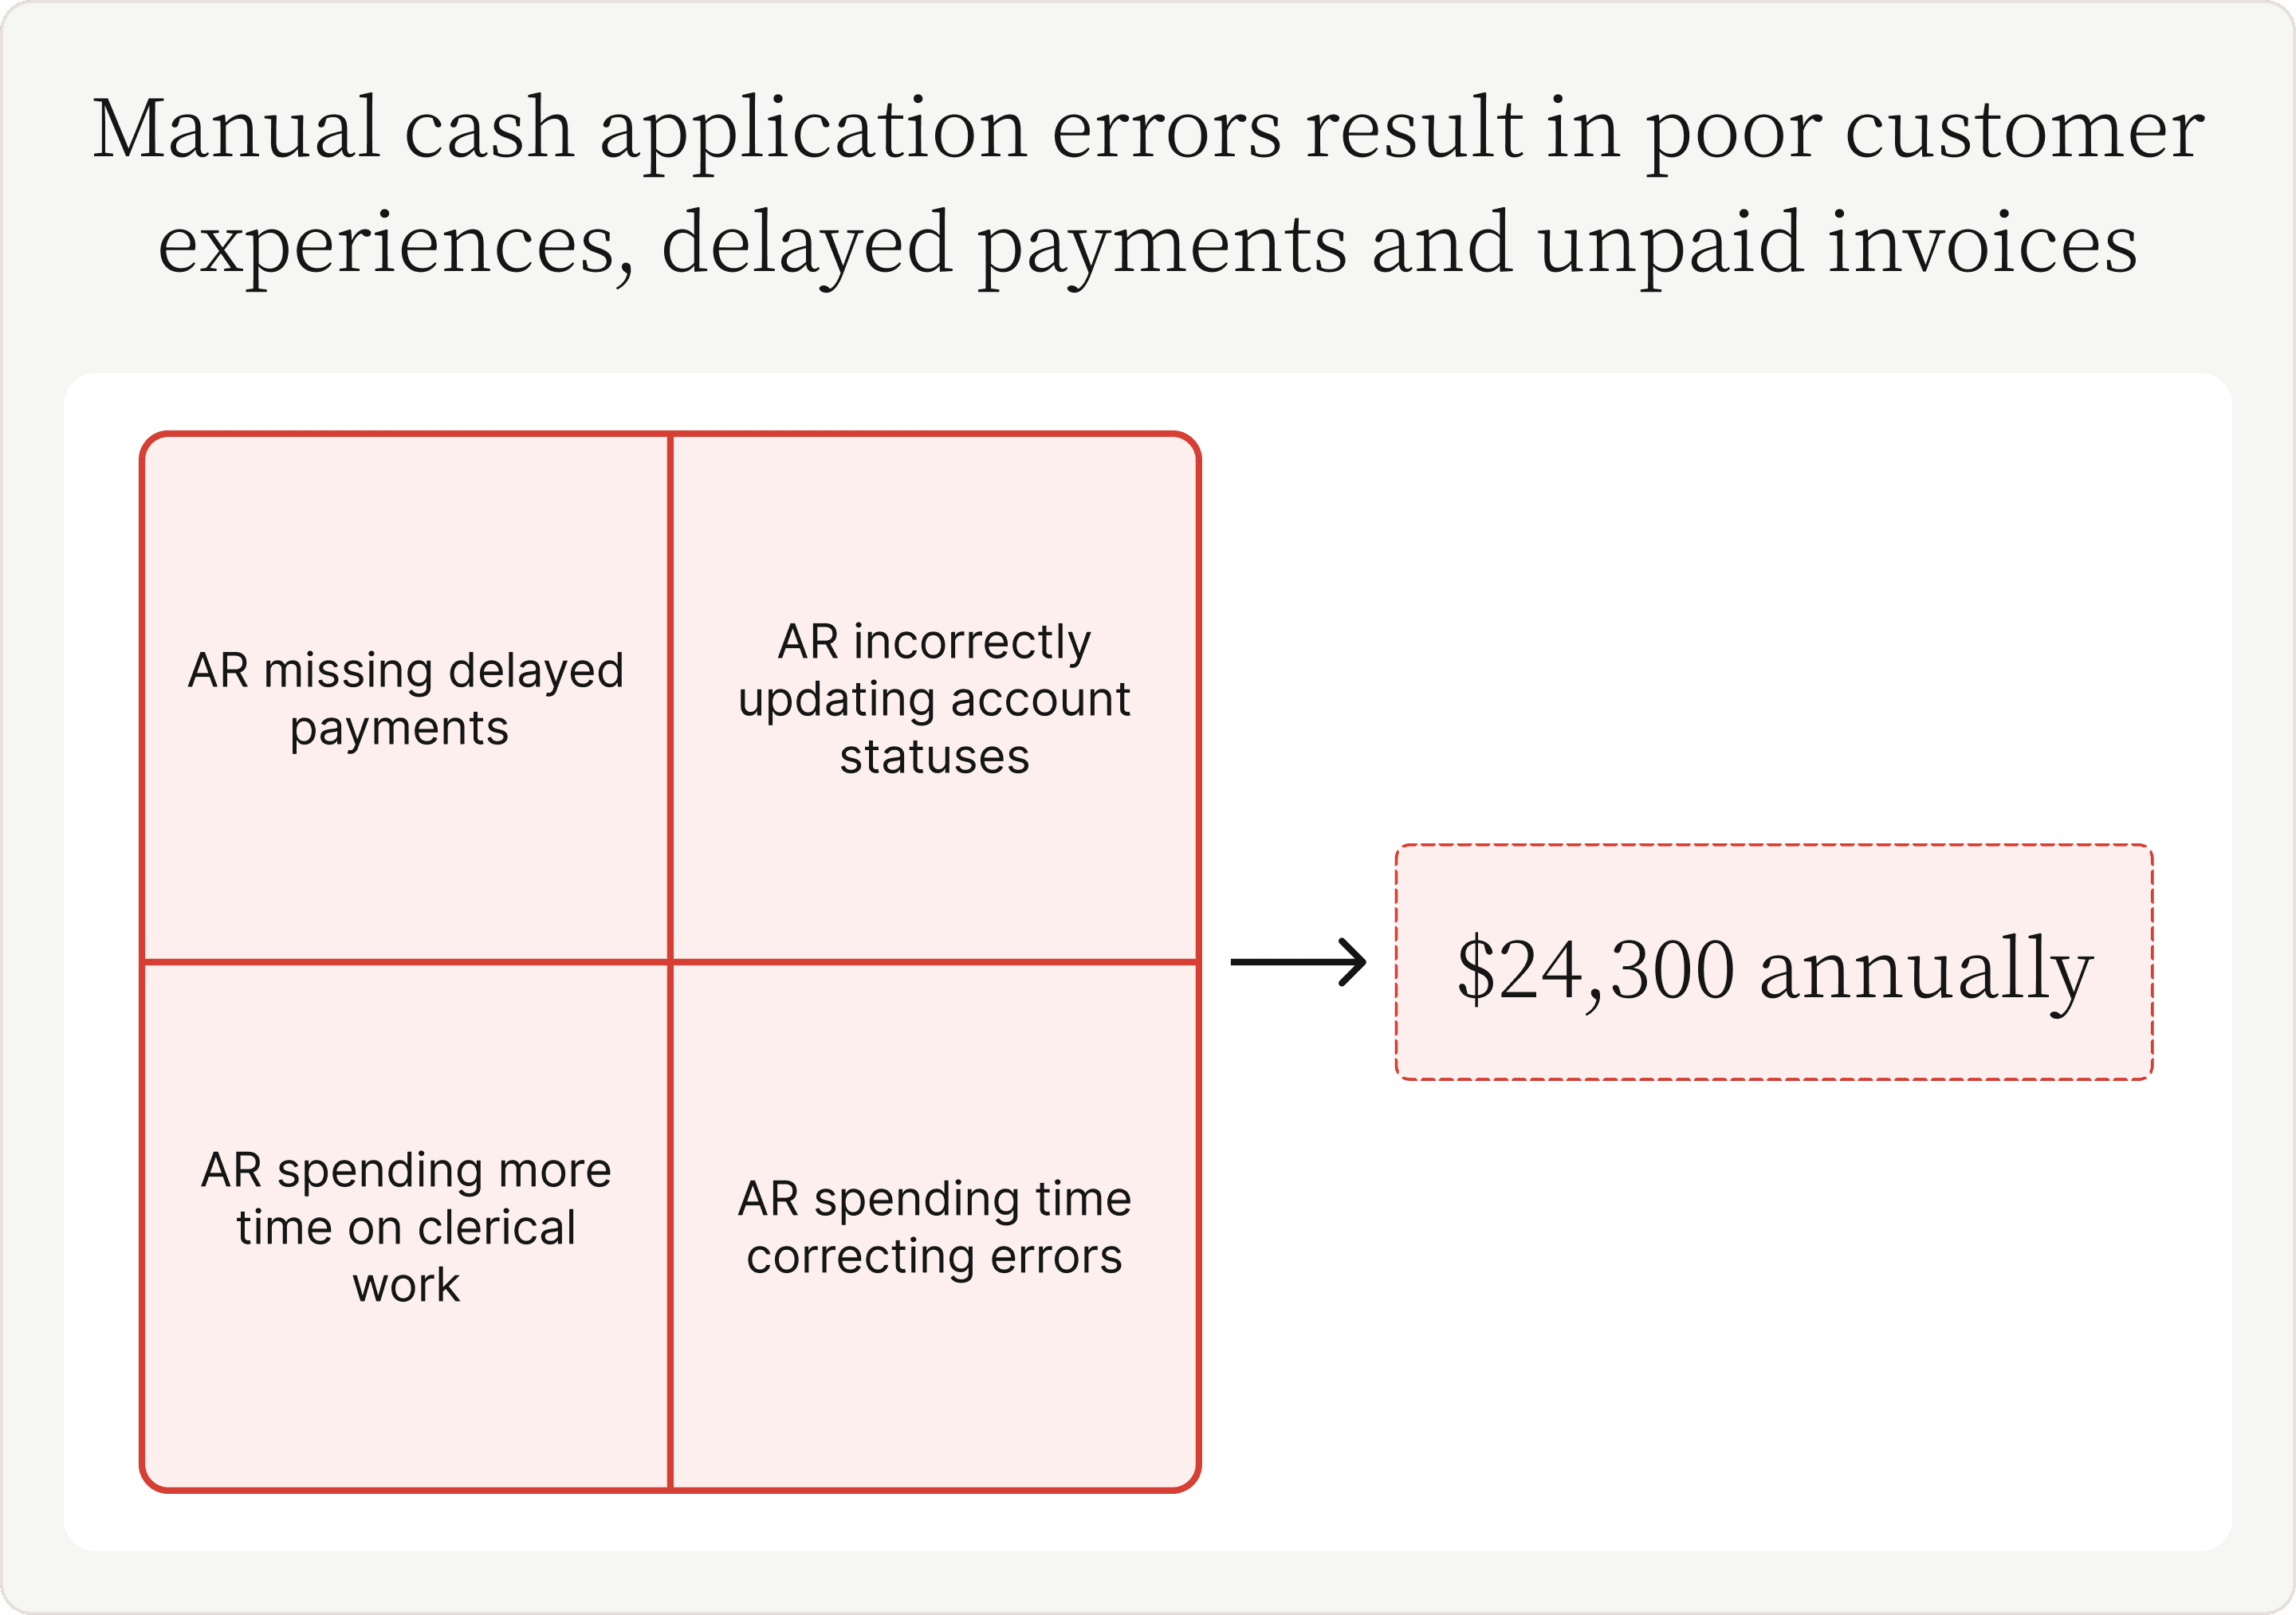
- The sheer volume of clerical works causes accounts receivable teams to miss delayed payments and unpaid invoices. Forrester's study notes that the composite organization spends $24,000 annually on manual cash application errors that result in poor customer experiences, delayed payments and unpaid invoices.
Versapay Cash Application Boosted Efficiency 69%
Customer experience statistics (2023)
Traditionally customer-facing departments—like marketing and professional services—are tasked with delivering excellent customer experiences, but organizations’ expectations are changing. Teams that tend not to be seen as impacting CX—like Finance—are now tasked with building better customer relationships.
However, knowing that building better relationships is a company-wide initiative does little to solve business’ deeply rooted problems. Namely, numerous stages of the business cycle contain functions which substantially raise customers’ frustrations and dampen their overall experiences.
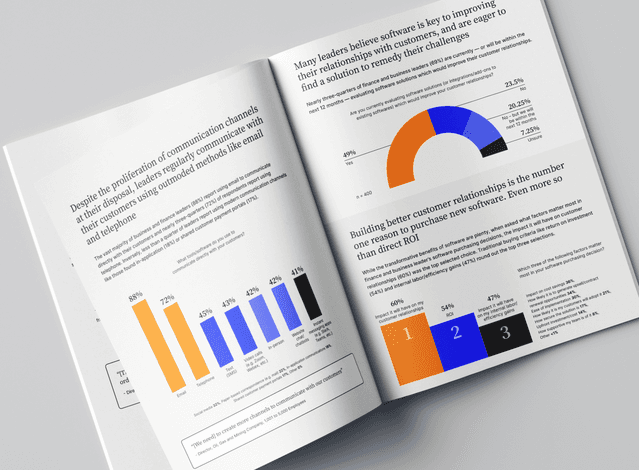
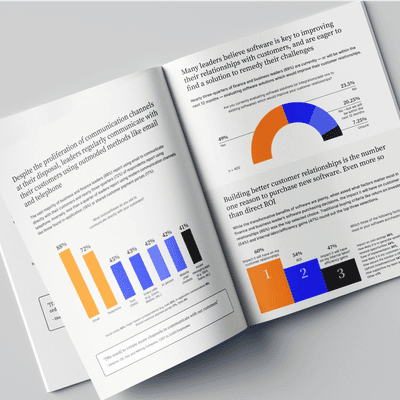
Many leaders believe that software is critical to improving customer relationships and are eager to find a solution. This belief is so pronounced that software’s impact on customer relationships has a greater influence on leaders’ buying decisions than direct ROI.
Using the Gartner Peer Community platform, Versapay surveyed 400 finance and business leaders to understand what business relations with customers actually looks like, which departments need to boost their CX efforts, and whether digitization is a feasible solution. The following statistics about customer experience explain why finance must prioritize enabling better communication, and become more customer-oriented.
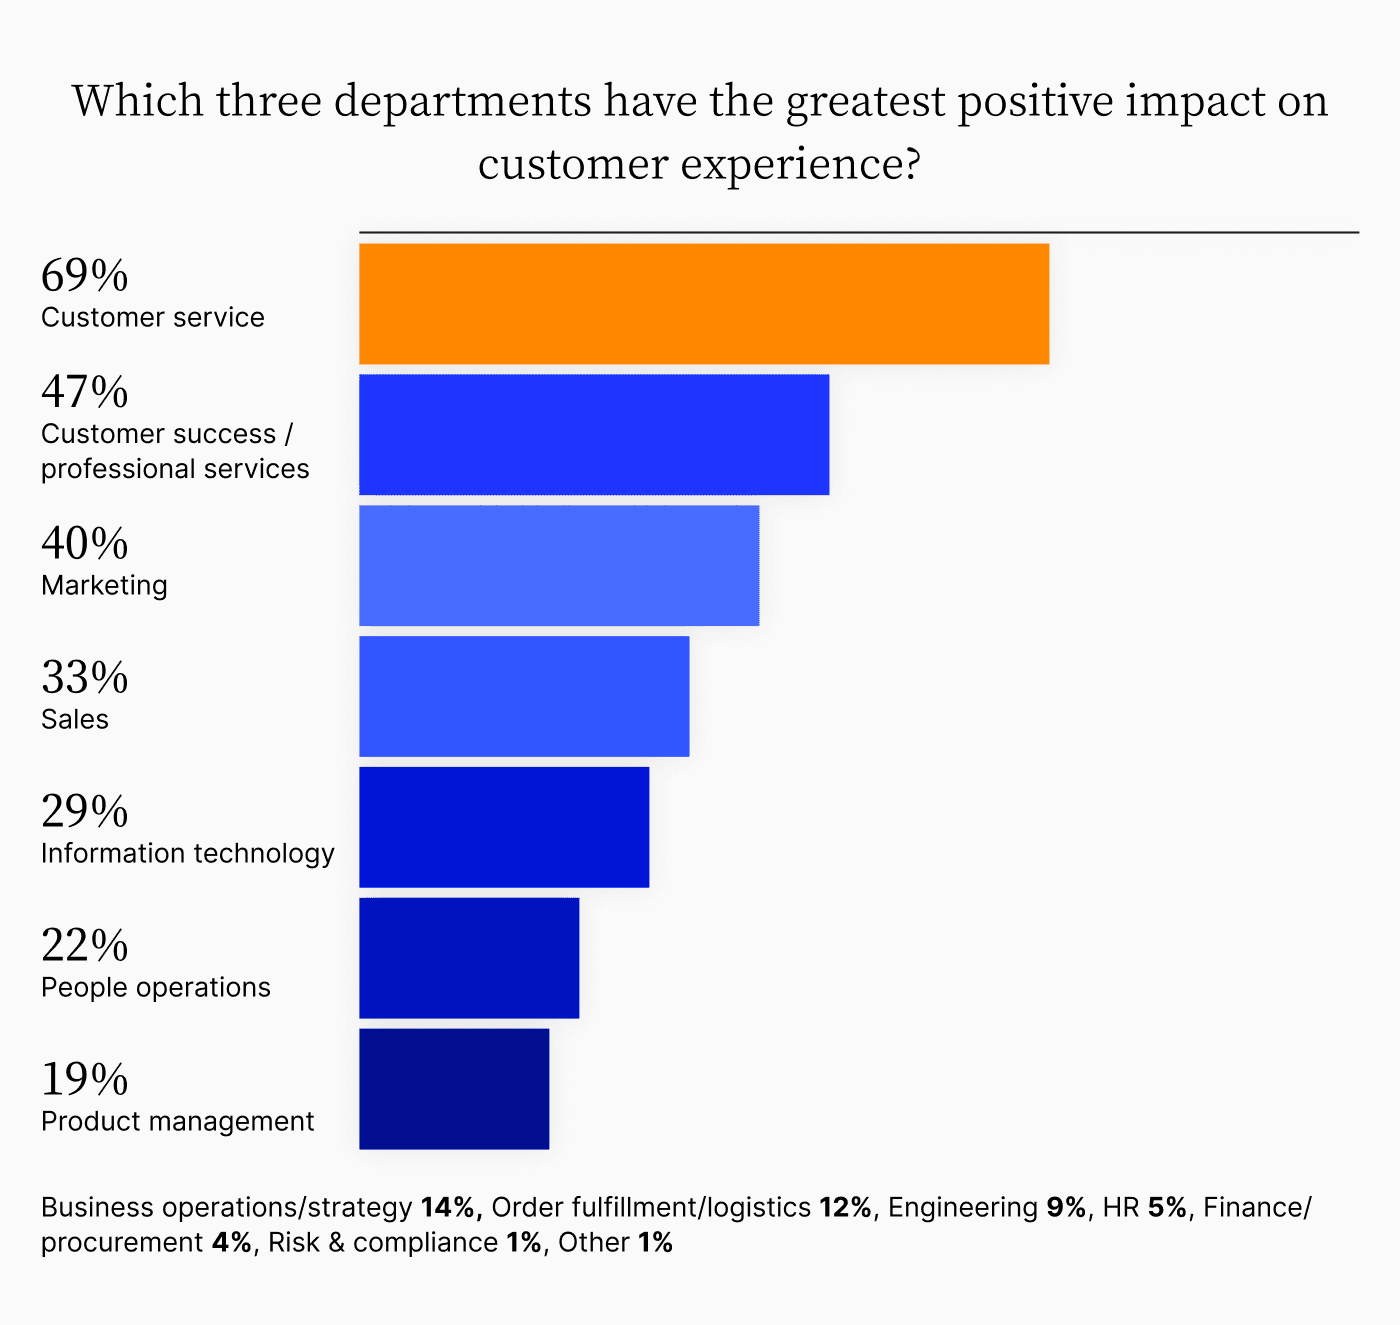
Only 4% of finance and business leaders selected finance/procurement when asked which three departments have the greatest impact on customer experience.
69% — Customer service
47% — Customer success / professional services
40% — Marketing
33% — Sales
29% — Information technology
22% — People operations
19% — Product management
14% — Business operations / strategy
12% — Order fulfillment / logistics
9% — Engineering
5% — Human resources
4% — Finance / procurement
1% — Risk and compliance
1% — Other
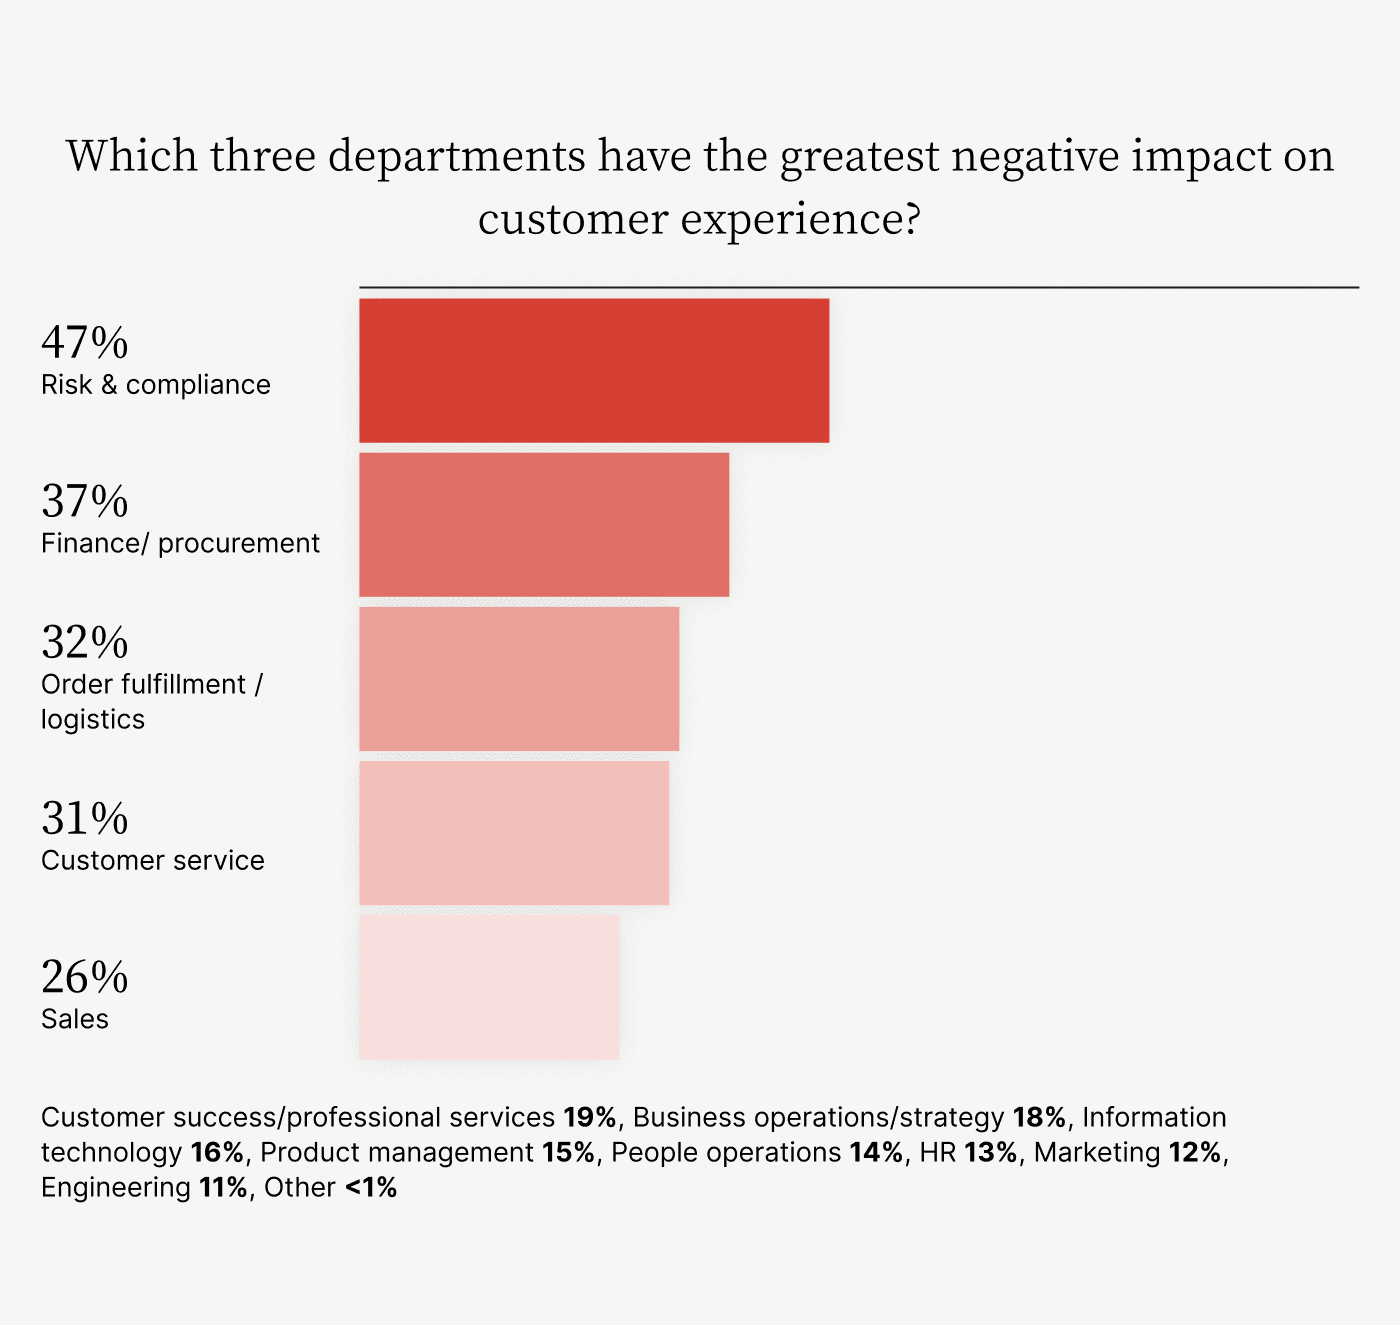
Finance and business leaders agree that finance / procurement is among the top three departments actively delivering a negative impact on customer experience.
47% — Risk and compliance
37% — Finance / procurement
32% — Order fulfillment / logistics
31% — Customer service
26% — Sales
19% — Customer success / professional services
18% — Business operations / strategy
16% — Information technology
15% — Product management
14% — People operations
13% — Human resources
12% — Marketing
11% — Engineering
1% — Other
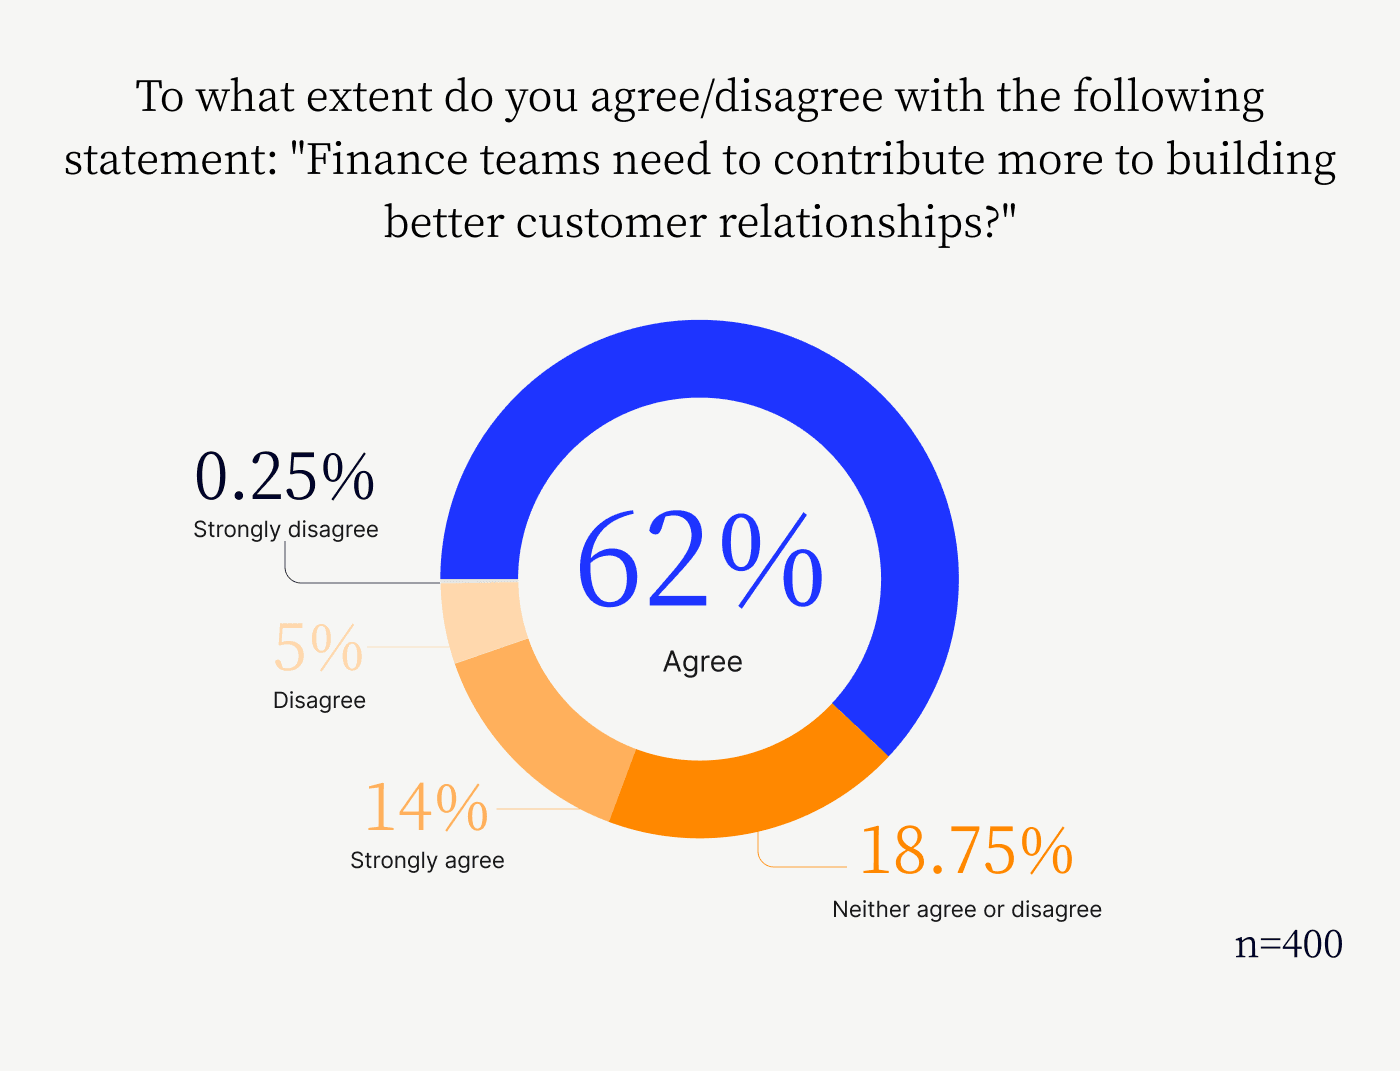
Over three quarters of finance and business leaders agree that finance teams need to contribute more to building better customer relationships.
14% — Strongly agree
62% — Agree
18.75% — Neither agree or disagree
5% — Disagree
0.25% — Strongly disagree
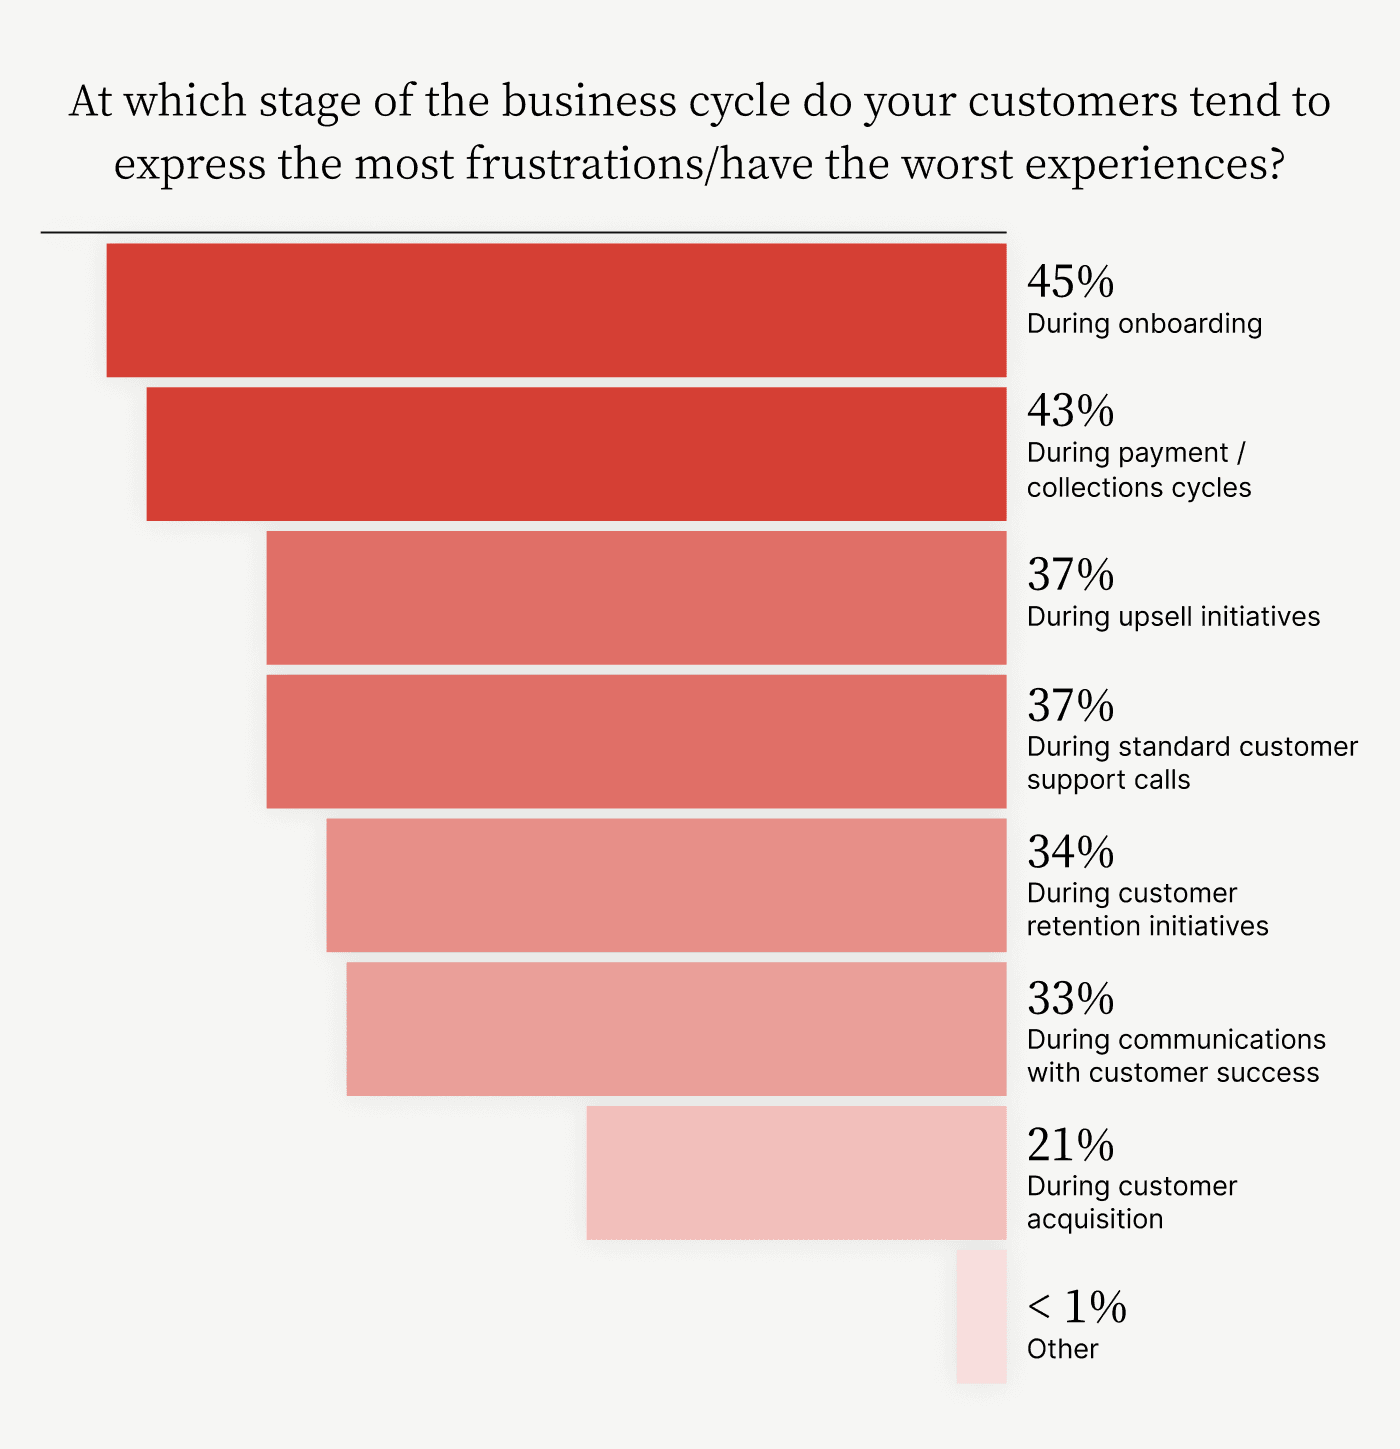
Finance and business leaders most frequently selected onboarding and payment / collections cycles as the stages of the business cycle where customers express the most frustration / have the worst experience.
45% — During onboarding
43% — During payment / collections cycles
37% — During upsell initiatives
37% — During standard customer support calls
34% — During customer retention initiatives
33% — During communications with customer success
21% — During customer acquisition
1% — Other
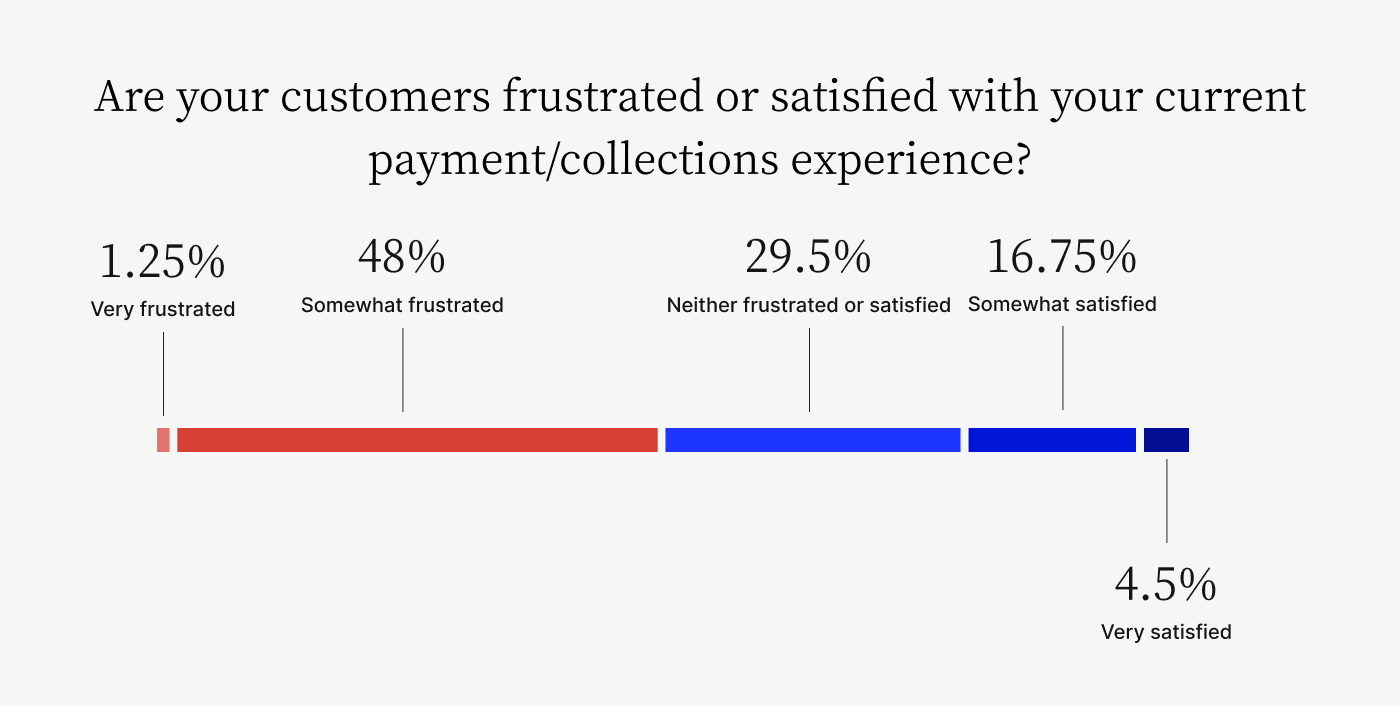
Less than a quarter of finance and business leaders report that their customers are satisfied or very satisfied with their current payment / collections experience.
4.50% — Very satisfied
16.75% — Somewhat satisfied
29.50% — Neither frustrated or satisfied
48% — Somewhat frustrated
1.25% — Very frustrated
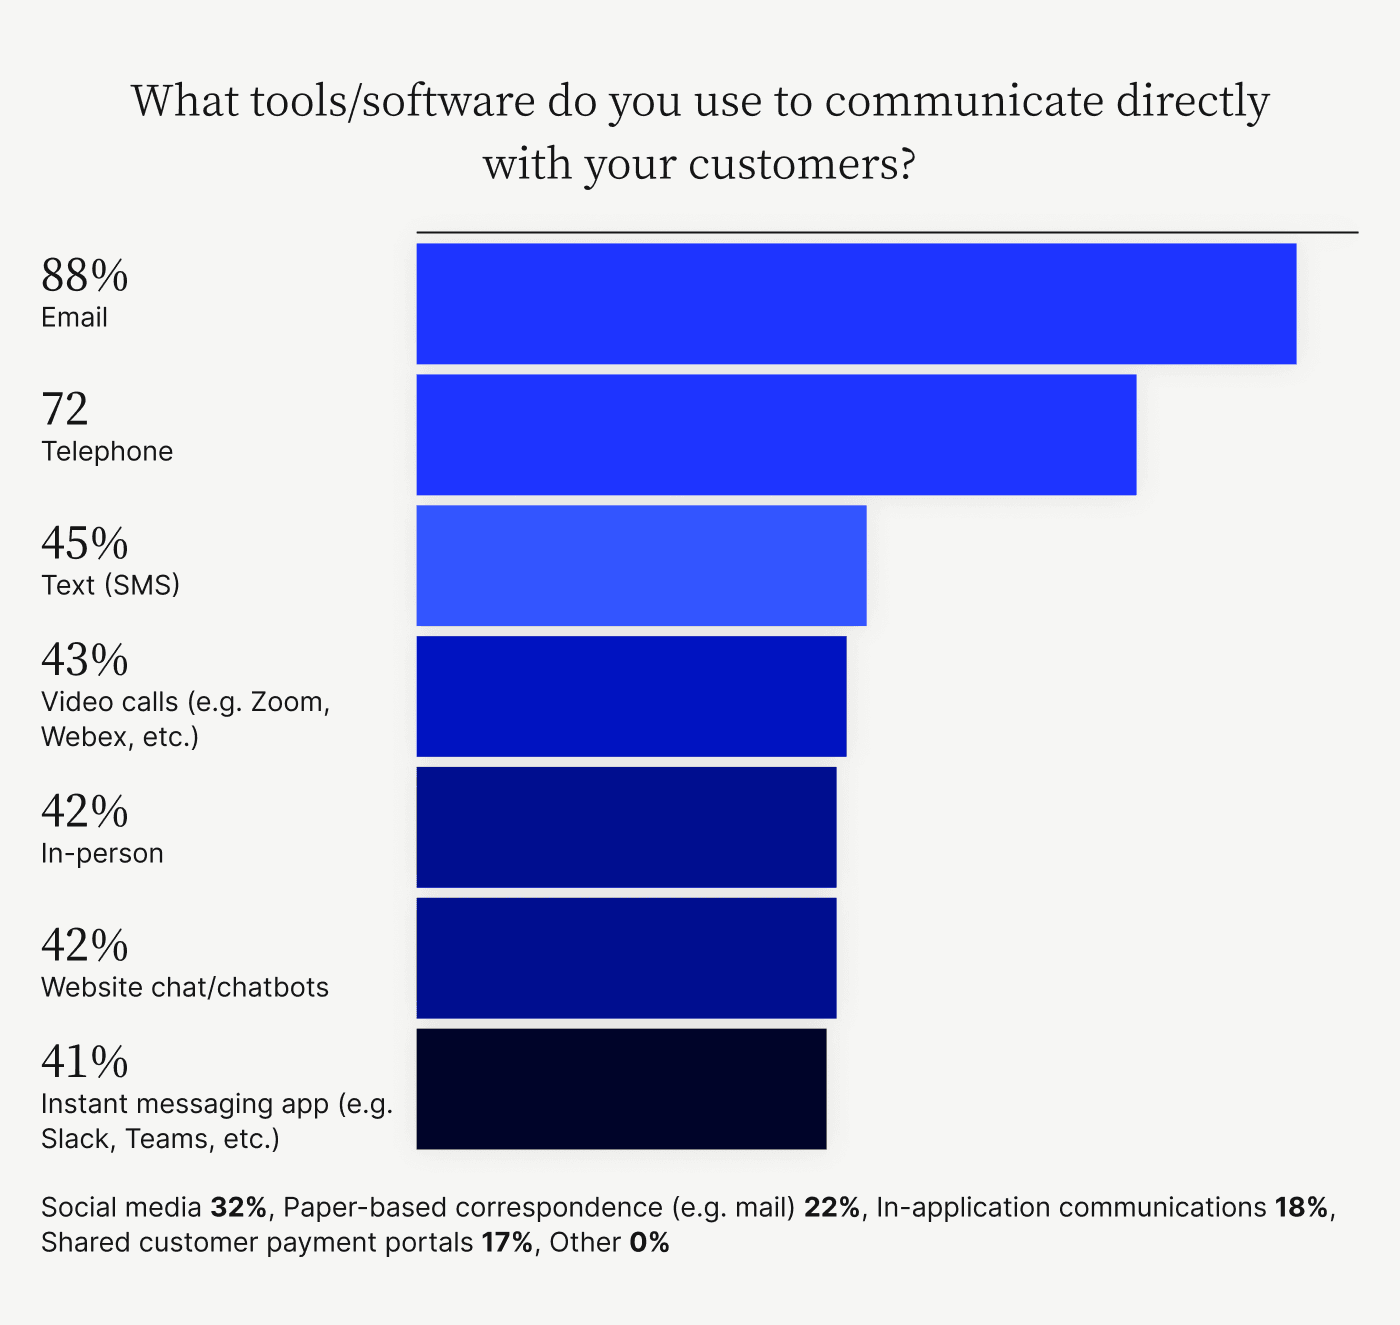
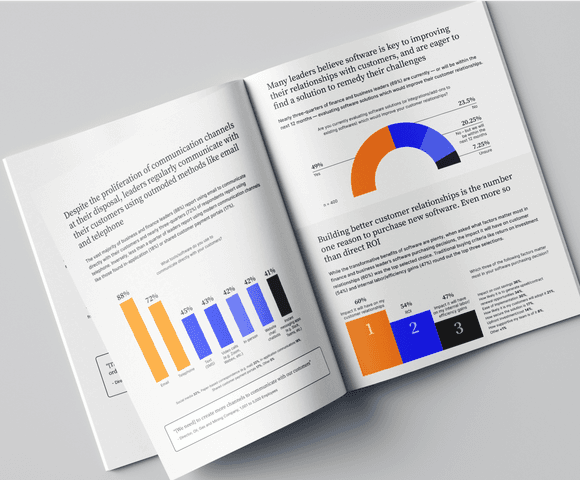
The vast majority of finance and business leaders use email to communicate directly with their customers and nearly three quarters use telephone. Inversely, less than a quarter of leaders use modern communication channels like those found in-application or in shared customer payment portals.
88% — Email
72% — Telephone
45% — Text (SMS)
43% — Video calls (Zoom, Webex, etc.)
42% — In-person
42% — Website chat / chatbots
41% — Instant messaging apps (Slack, Teams, etc.)
32% — Social media
22% — Paper-based correspondence (Mail, etc.)
18% — In-application communications
17% — Shared customer payment portals
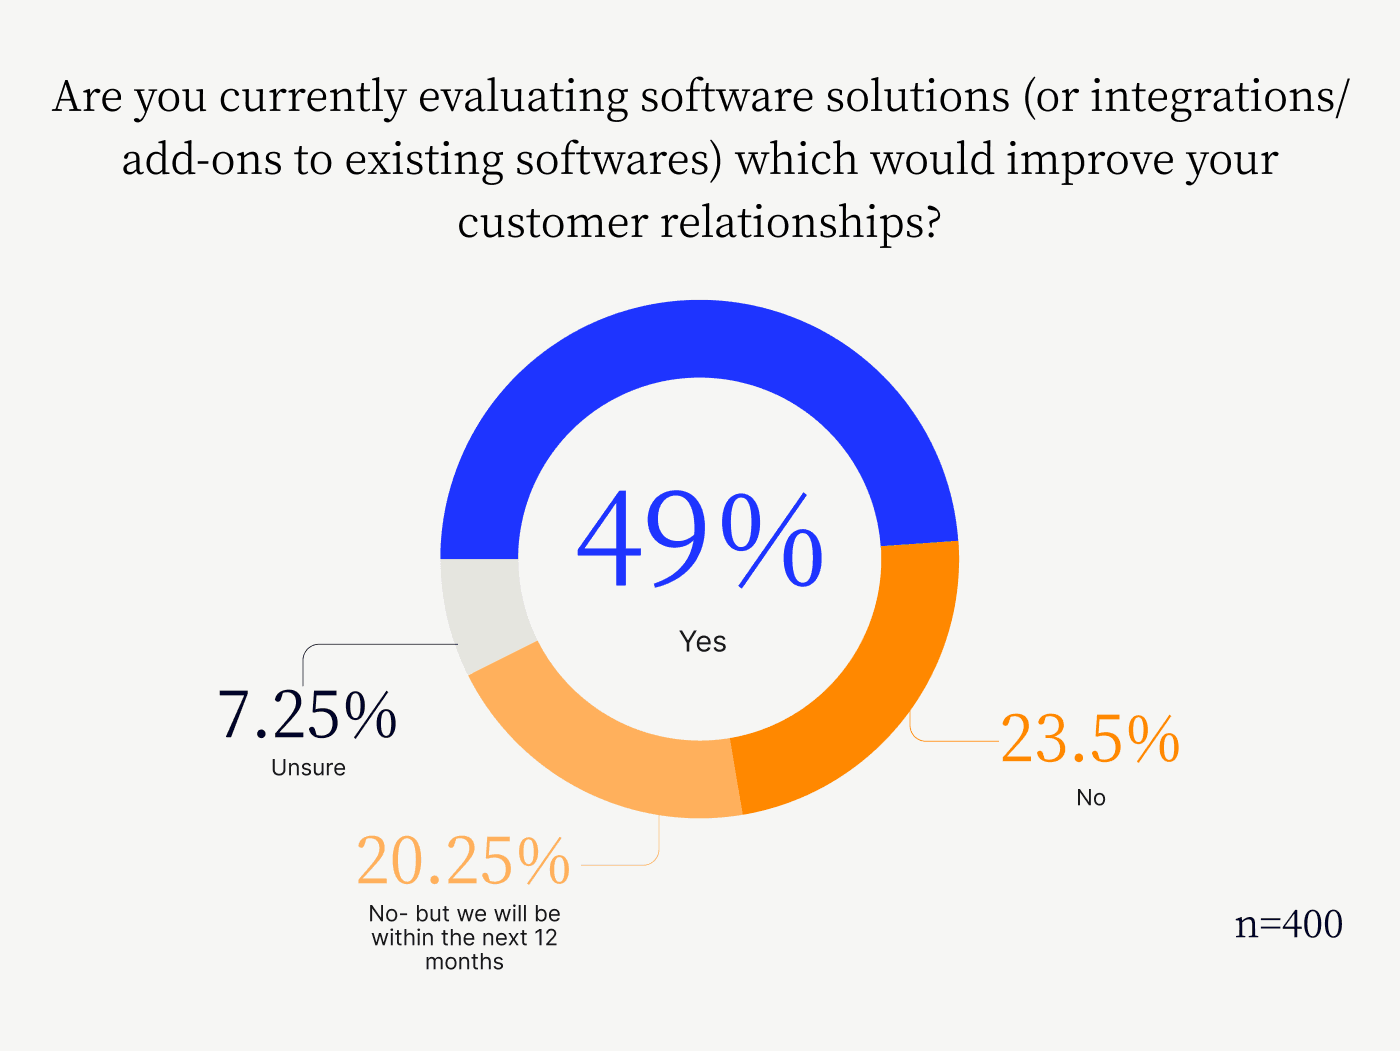
Nearly three quarters of finance and business leaders are currently — or will be within the next 12 months — evaluating software solutions which would improve their customer relationships.
49% — Yes
23.50% — No
20.25% — No, but we will be within the next 12 months
7.25% — Unsure
While the transformative benefits of software are plenty, the factor that matters most in finance and business leaders’ purchasing decisions is the impact it will have on customer relationships.
60% — Impact it will have on my customer relationships
54% — Return on investment
47% — Impact it will have on my internal labor / efficiency gains
36% — Impact on cost savings
34% — How likely it is to generate upsell / contract renewal opportunities
30% — Ease of implementation
21% — How likely it is my customers will adopt it
17% — How secure the solution is
14% — Upfront investment / cost
8% — How supportive my team is of it
< 1% — Other
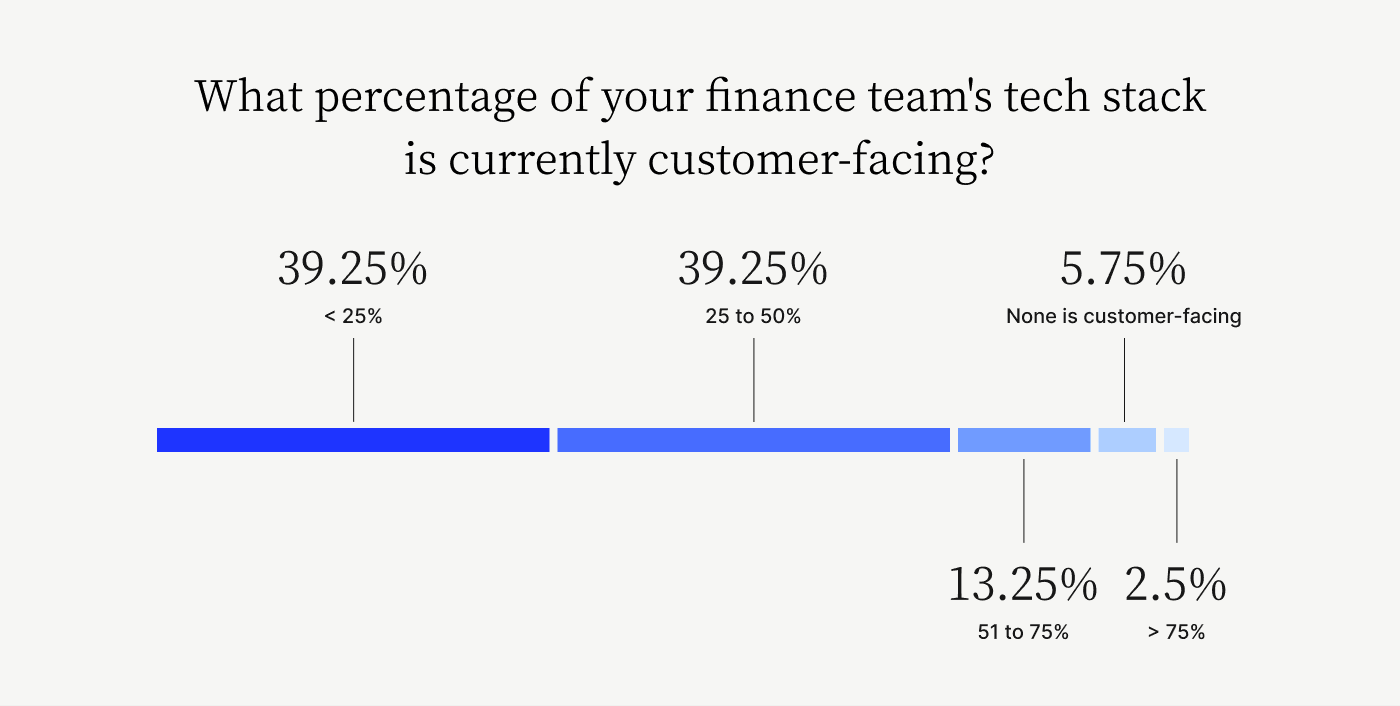
Just 16% of finance and business leaders report that more than 50% of their finance team’s tech stack is currently customer facing.
39.25% — < 25%
39.25% — 25 to 50%
13.25% — 51 to 75%
2.50% — > 75%
5.75% — None is customer facing
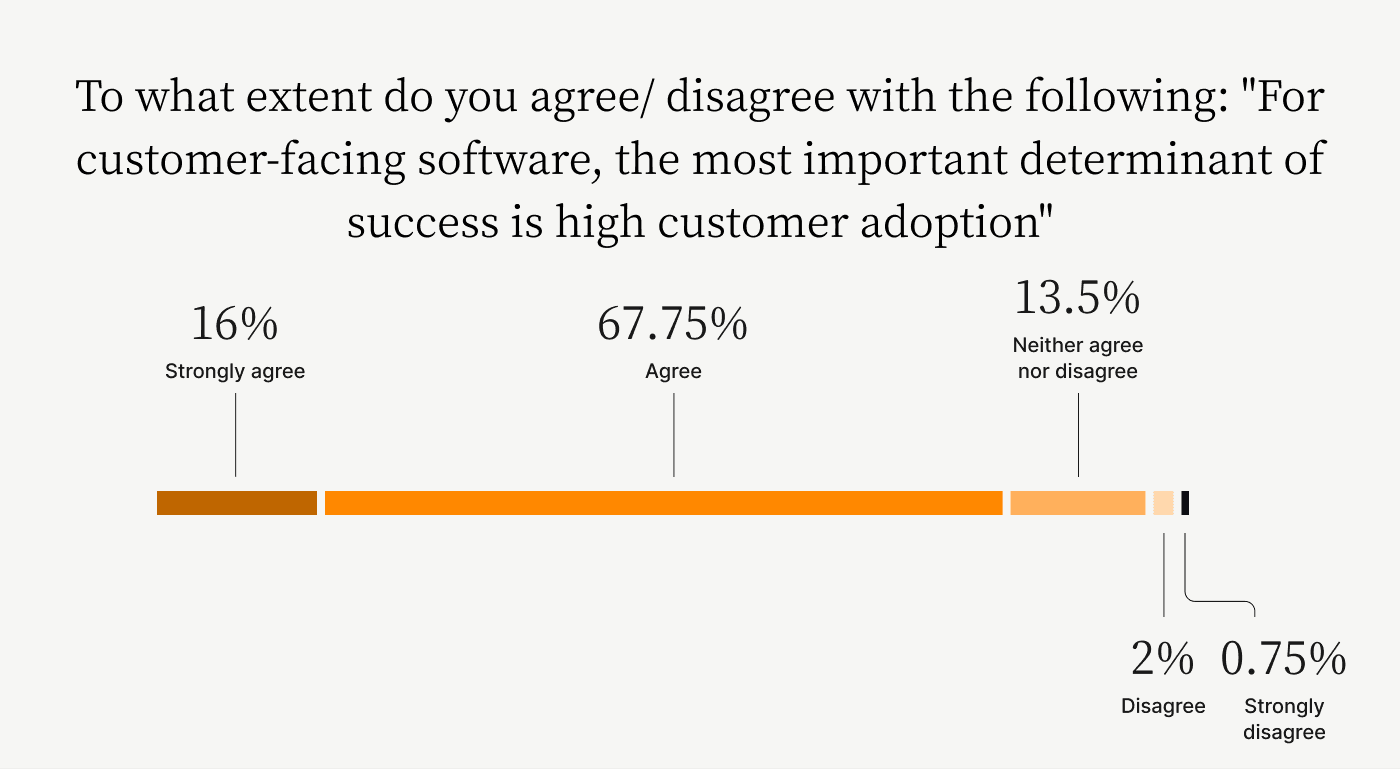
Over four fifths of finance and business leaders agree that high customer adoption rates are the most important criteria in determining how successful customer-facing software is.
16% — Strongly agree
67.75% — Agree
13.50% — Neither agree or disagree
2% — Disagree
0.75% — Strongly disagree
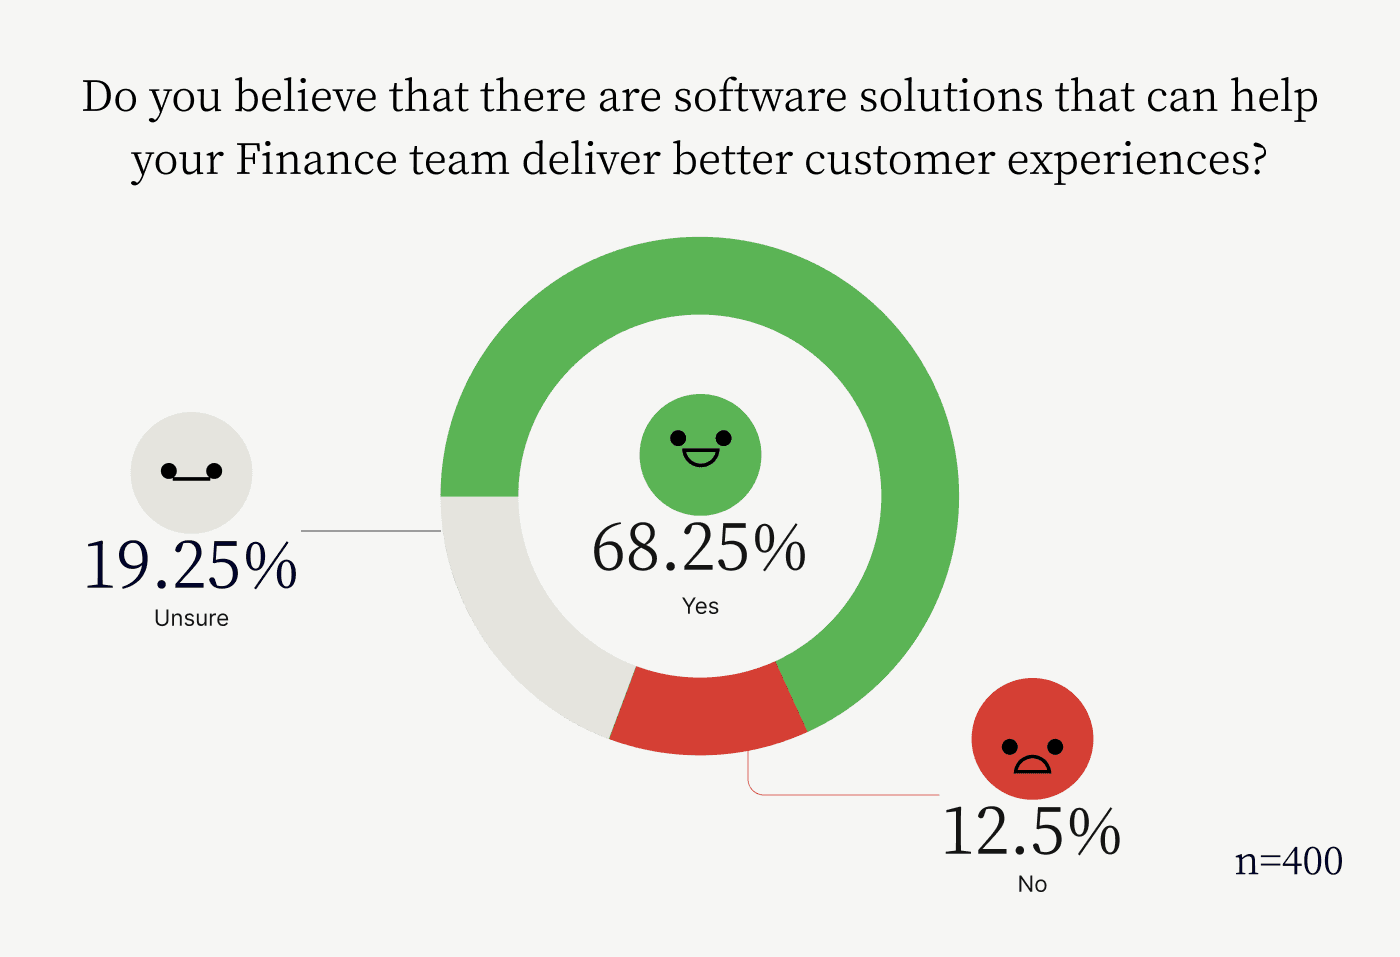
A majority of finance and business leaders believe that software solutions exist that can help finance teams deliver better customer experiences.
68.25% — Yes
12.50% — No
19.25% — Unsure
Building Better Customer Relationships
Invoice processing and accounts receivable payment portal statistics (2023)
Invoice processing is a mission-critical function for businesses, yet it remains a formidable—and often consequential—challenge for most. The process—which begins with creating an invoice and ends with receiving payment—is seemingly simple, yet rife with complexities.
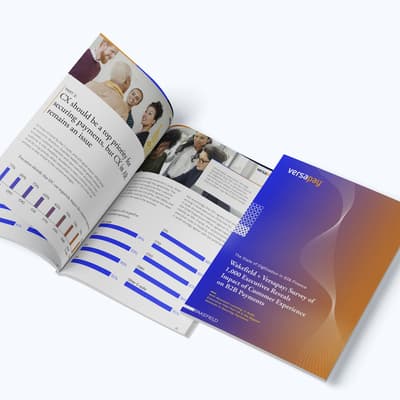
So, in collaboration with Wakefield Research, we surveyed 300 Chief Financial Officers to:
- Quantify the impact poor, inefficient invoicing processes have
- Determine whether collaborative accounts receivable payment portals can dissolve the invoicing challenges CFOs face
- Determine whether collaborative accounts receivable payment portals are superior to standard payment portals
- Identify the criteria decision-makers use when considering adopting these technologies.
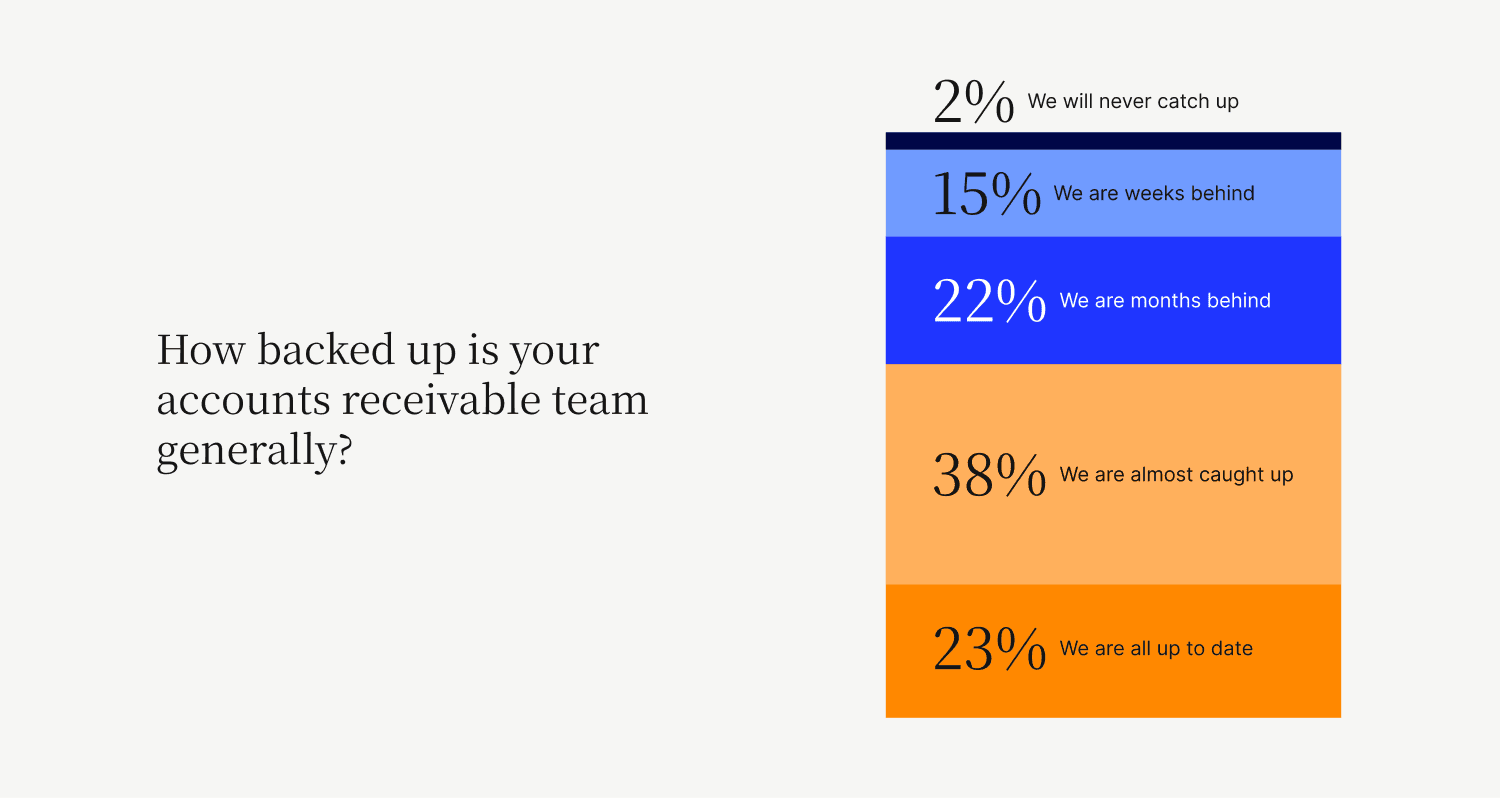
We found that invoice processing complications are so profound that nearly 2 in 5 (39%) CFOs report their accounts receivable (AR) teams are weeks or months behind and will never catch up on invoices. Less than a quarter of CFOs (23%) report their AR teams are completely up to date on invoices. Here's everything else we found:
- Less than a quarter of accounts receivable teams are completely up-to-date, with the majority (77%) backed up to some extent.
- 22.67% — We are all up to date
- 38.33% — We are almost caught up
- 14.67% — We are weeks behind
- 22% — We are months behind
- 2.33% — We will never catch up
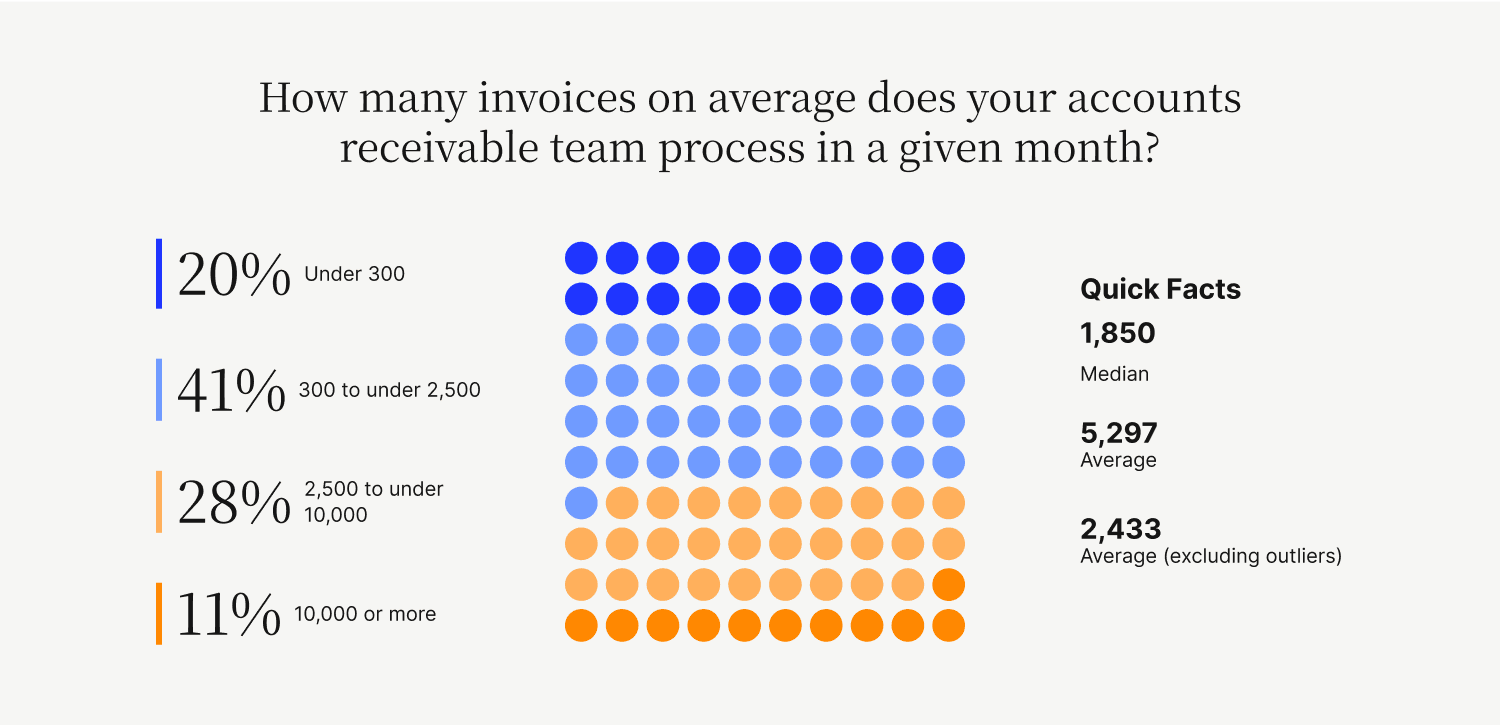
- The average number of invoices a mid- to upper-mid market accounts receivable team processes in a given month is nearly 2,500.
- 20.33% — Under 300
- 41% — 300 to under 2,500
- 28.33% — 2,500 to under 10,000
- 10.33% — 10,000 or more
- 1,850 — Median
- 5,297 — Average
- 2,433 — Average (excluding outliers)
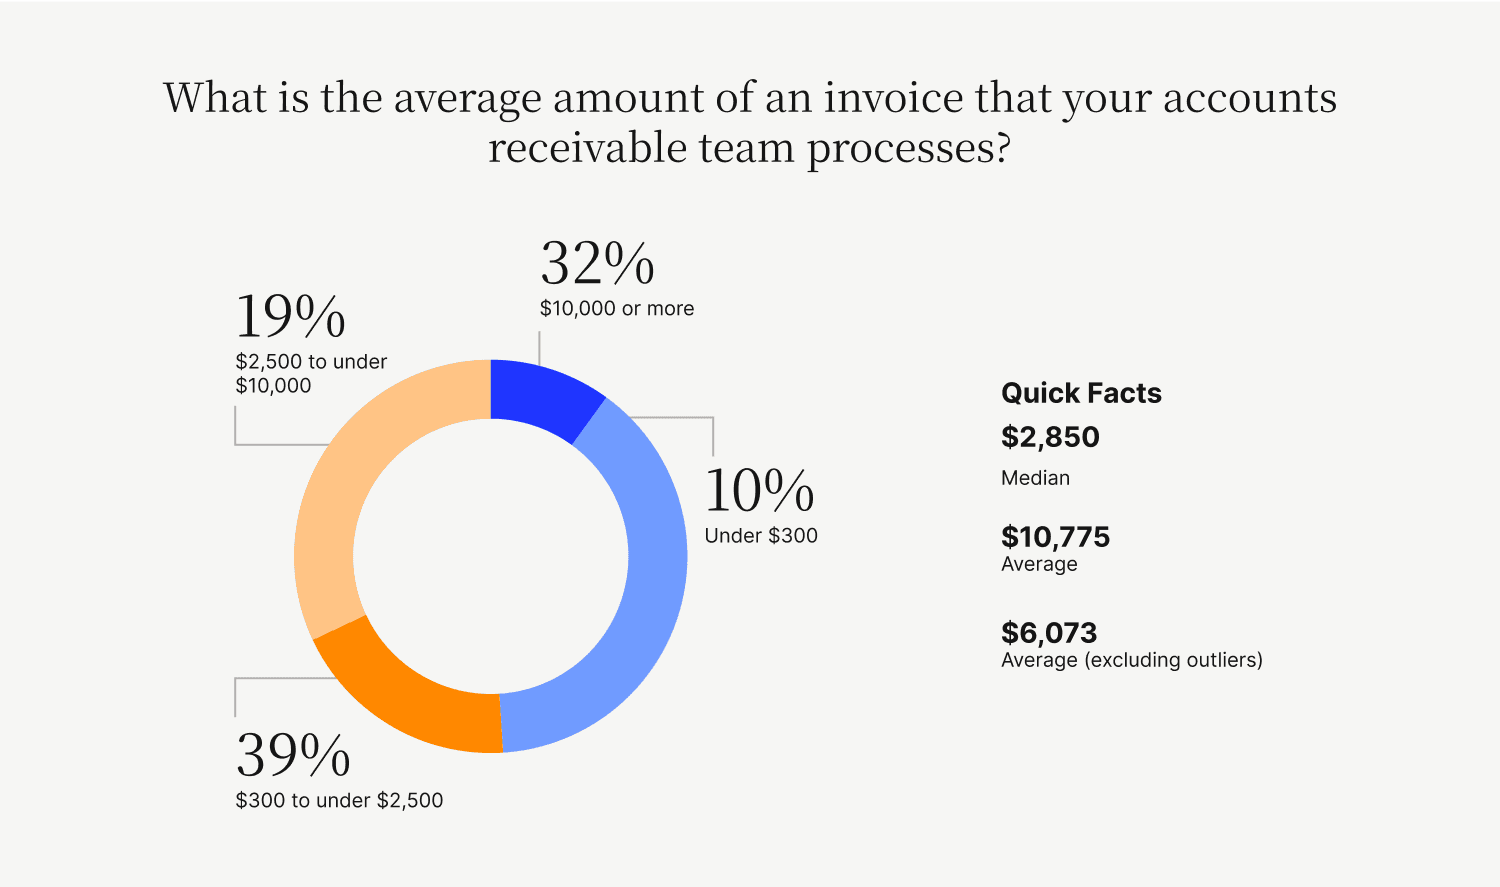
- The average invoice amount a mid- to upper-mid market accounts receivable team processes in a given month is over $6,000.
- 9.67% — Under $300
- 39% — $300 to under $2,500
- 19.33% — $2,500 to under $10,000
- 32% — $10,000 or more
- $2,850 — Median
- $10,775 — Average
- $6,073 — Average (excluding outliers)
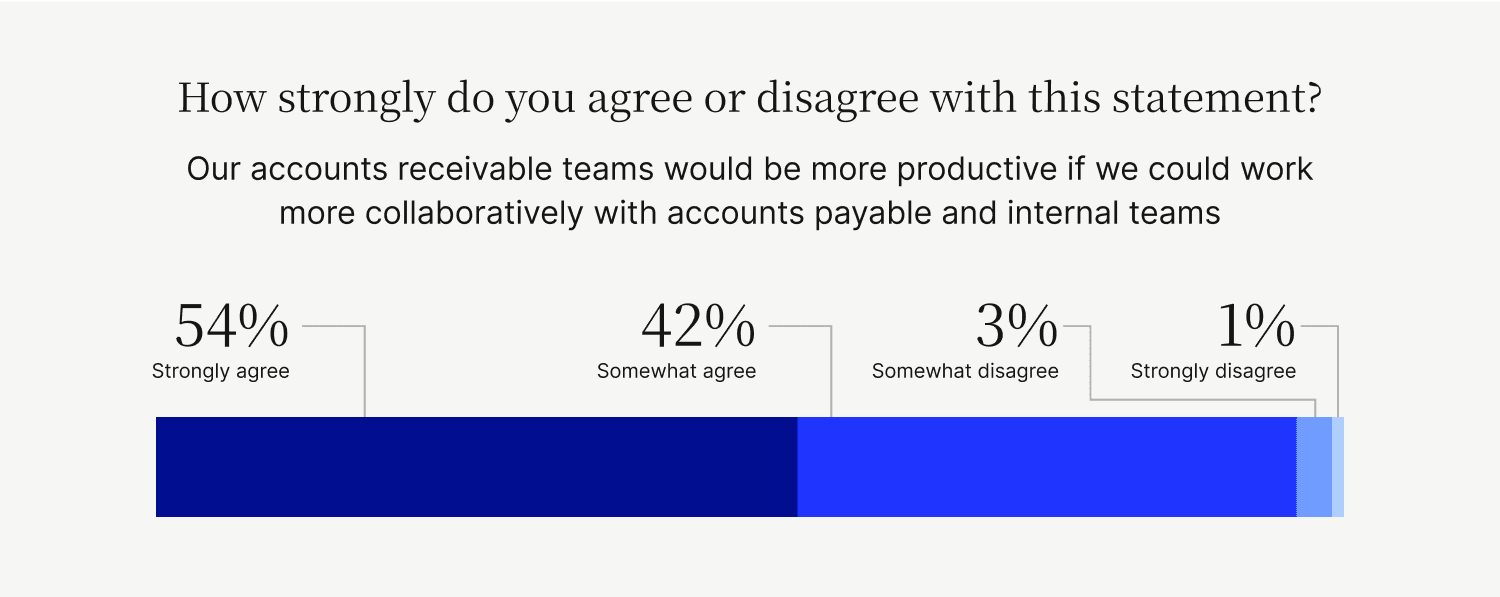
- CFOs nearly unanimously agree that their accounts receivable teams would be more productive if they could work more collaboratively with accounts payable (external) and internal teams.
- 54% — Strongly agree
- 42.33% — Somewhat agree
- 3.33% — Somewhat disagree
- 0.33% — Strongly disagree
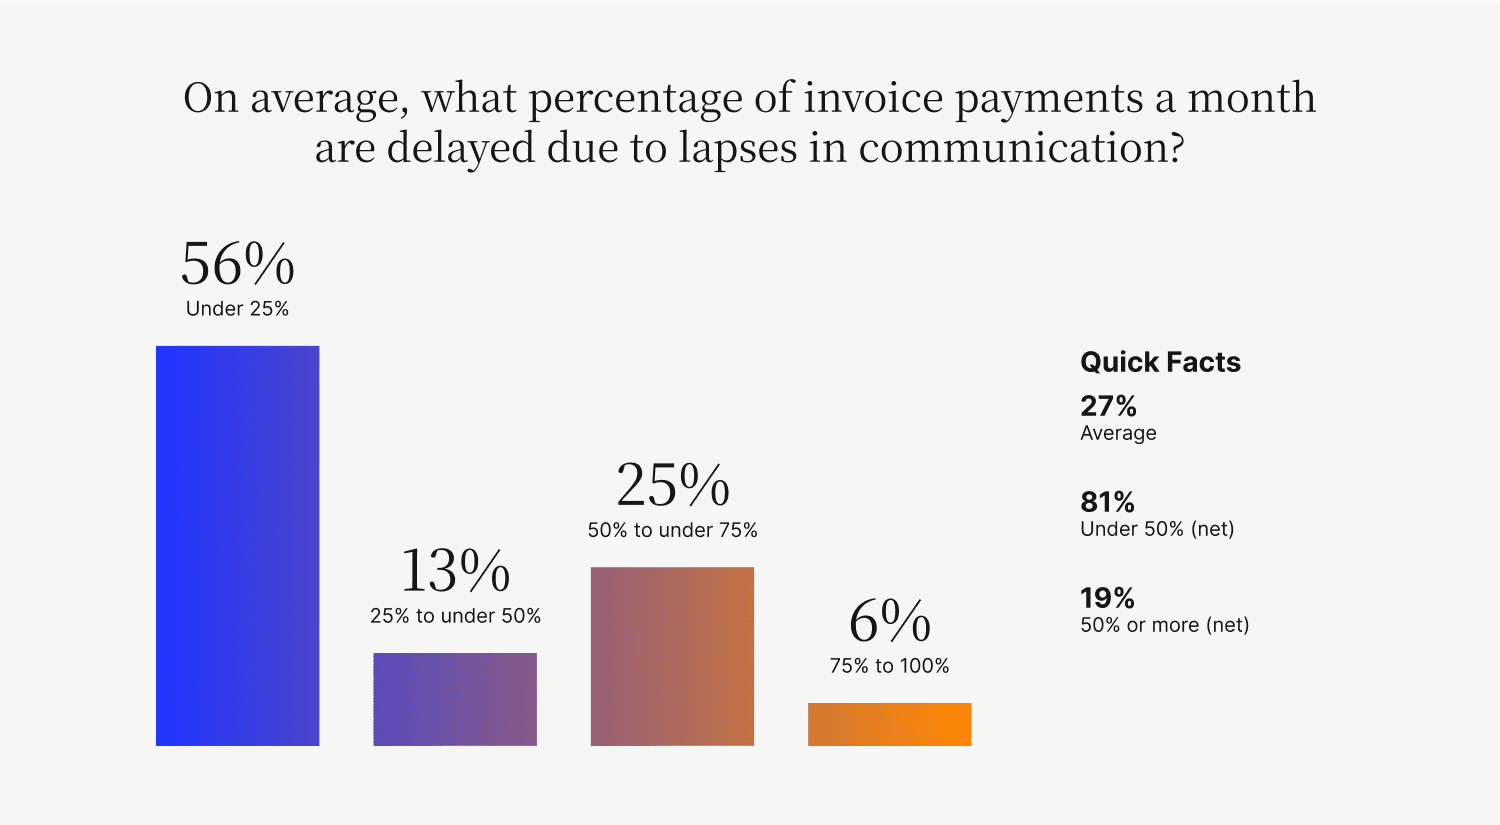
- On average, over a quarter of invoice payments monthly are delayed due to lapses in communication.
- 56.33% — Under 25% (of payments are delayed monthly)
- 13% — 25% to under 50%
- 24.67% — 50% to under 75%
- 6% — 75% to 100%
- 26.85% — Average
- 81% — Under 50% (net)
- 19% — 50% or more (net)
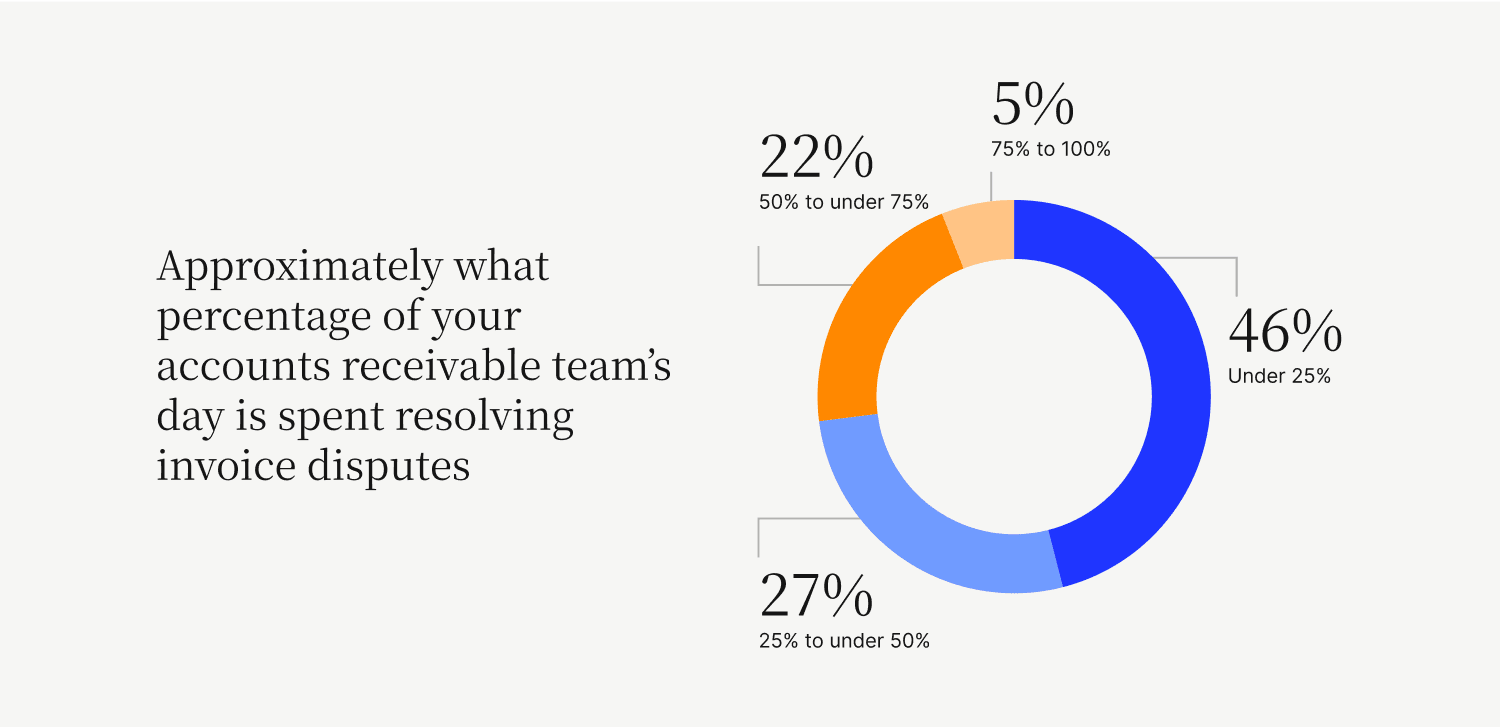
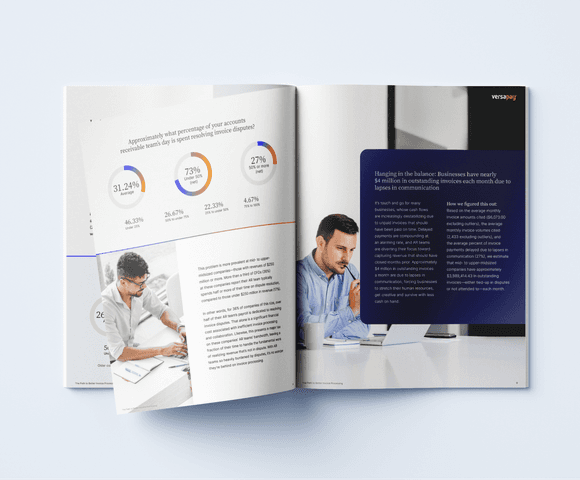
- Nearly one third of accounts receivable teams’ days are spent resolving invoice disputes.
- 46.33% — Under 25% (of the day is spent resolving disputes)
- 26.67% — 25% to under 50%
- 22.33% — 50% to under 75%
- 4.67% — 75% to 100%
- 31.24% — Average
- 73% — Under 50% (net)
- 27% — 50% or more (net)
- Businesses have nearly $4 million in outstanding invoices each month due to lapses in communication.
- How we figured this out: Based on the average monthly invoice amounts cited ($6,073.00 excluding outliers), the average monthly invoice volumes cited (2,433 excluding outliers), and the average percent of invoice payments delayed due to lapses in communication (27%), we estimate that mid- to upper-midsized companies have approximately $3,989,414.43 in outstanding invoices—either tied-up in disputes or not attended to—each month.
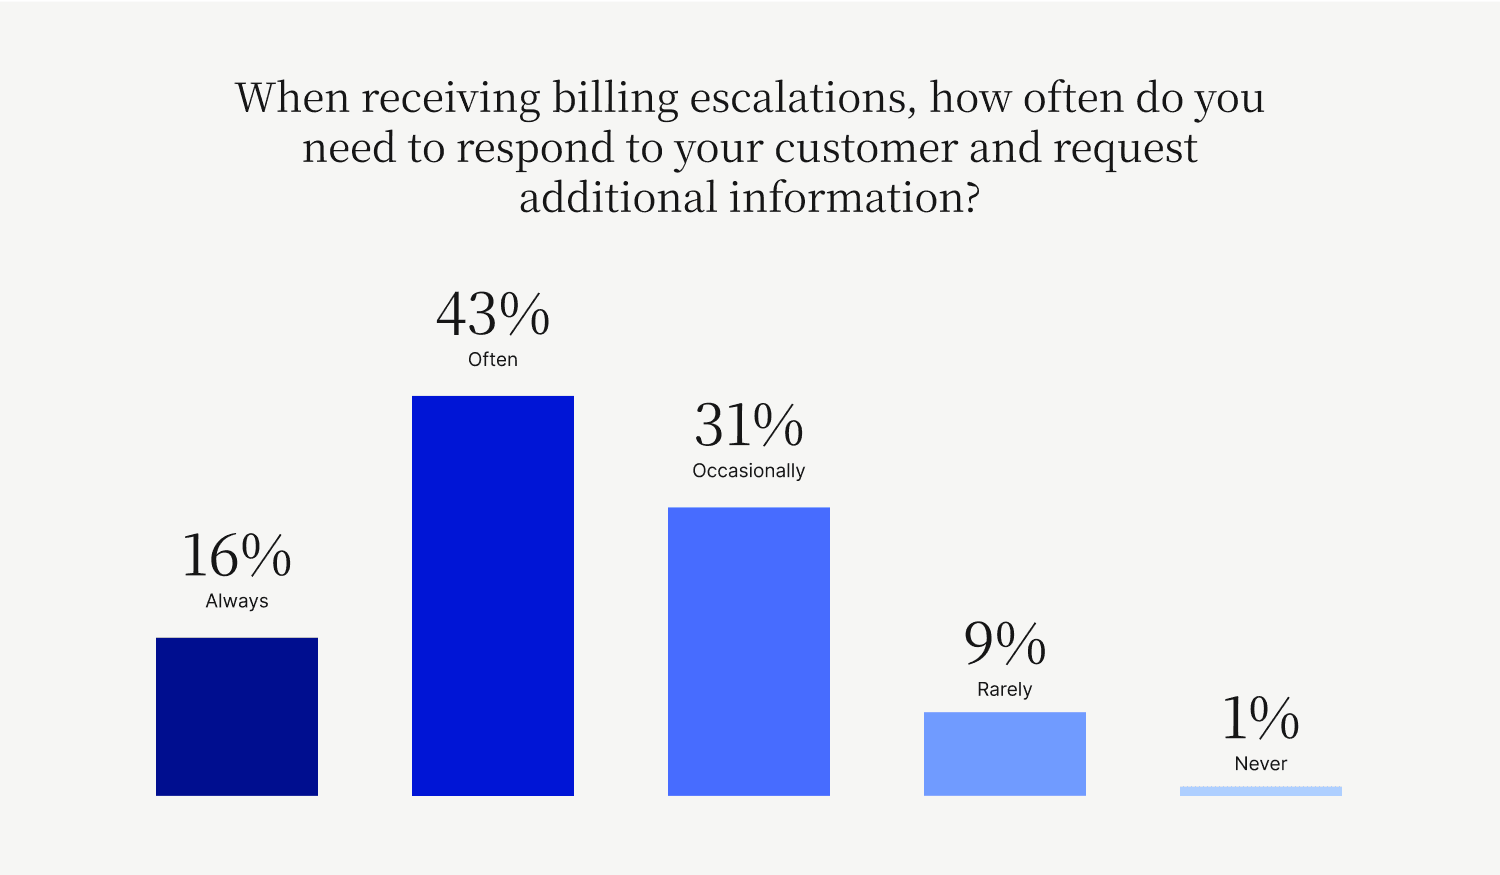
- When receiving billing escalations, nearly every accounts receivable team has to at least occasionally respond their their customers and request additional information
- 16.67% — Always
- 42.67% — Often
- 31.33% — Occasionally
- 8.67% — Rarely
- 0.67% — Never
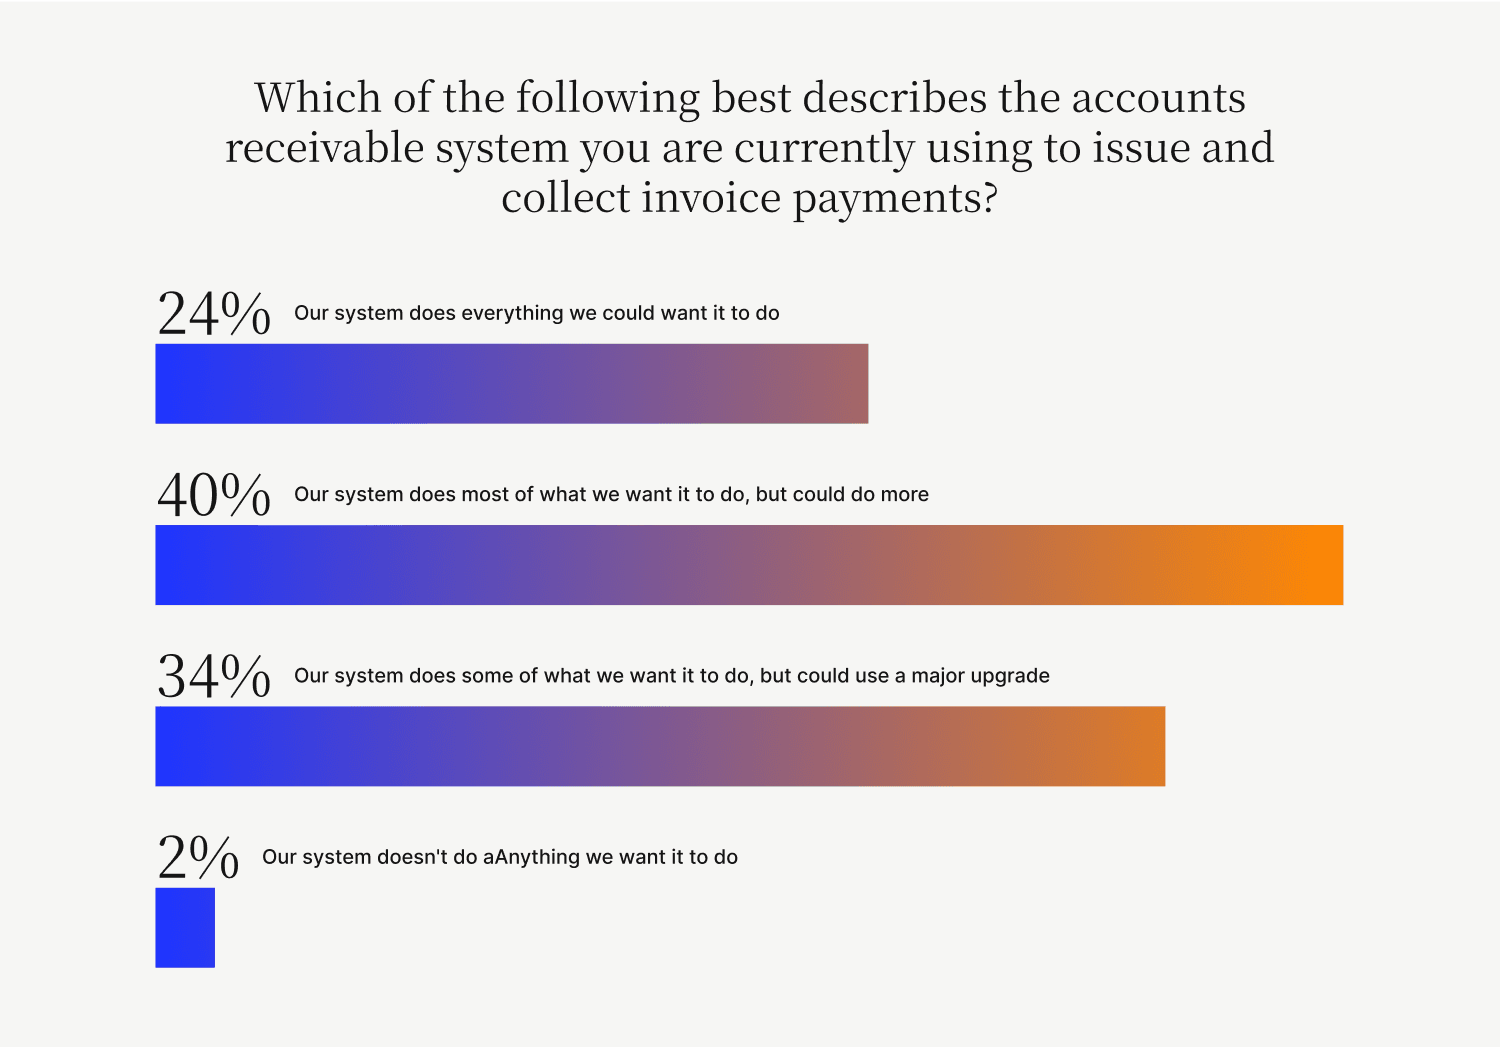
- More than three quarters of CFOs report their current accounts receivable portals (or systems that they’re using to currently issue and collect invoice payments) do not do everything they want them to do.
- 24% — Our system does everything we could want it to do
- 40% — Our system does most of what we want it to do, but could do more
- 34% — Our system does some of what we want it to do, but could use a major upgrade
- 2% — Our system doesn’t do anything we want it to do
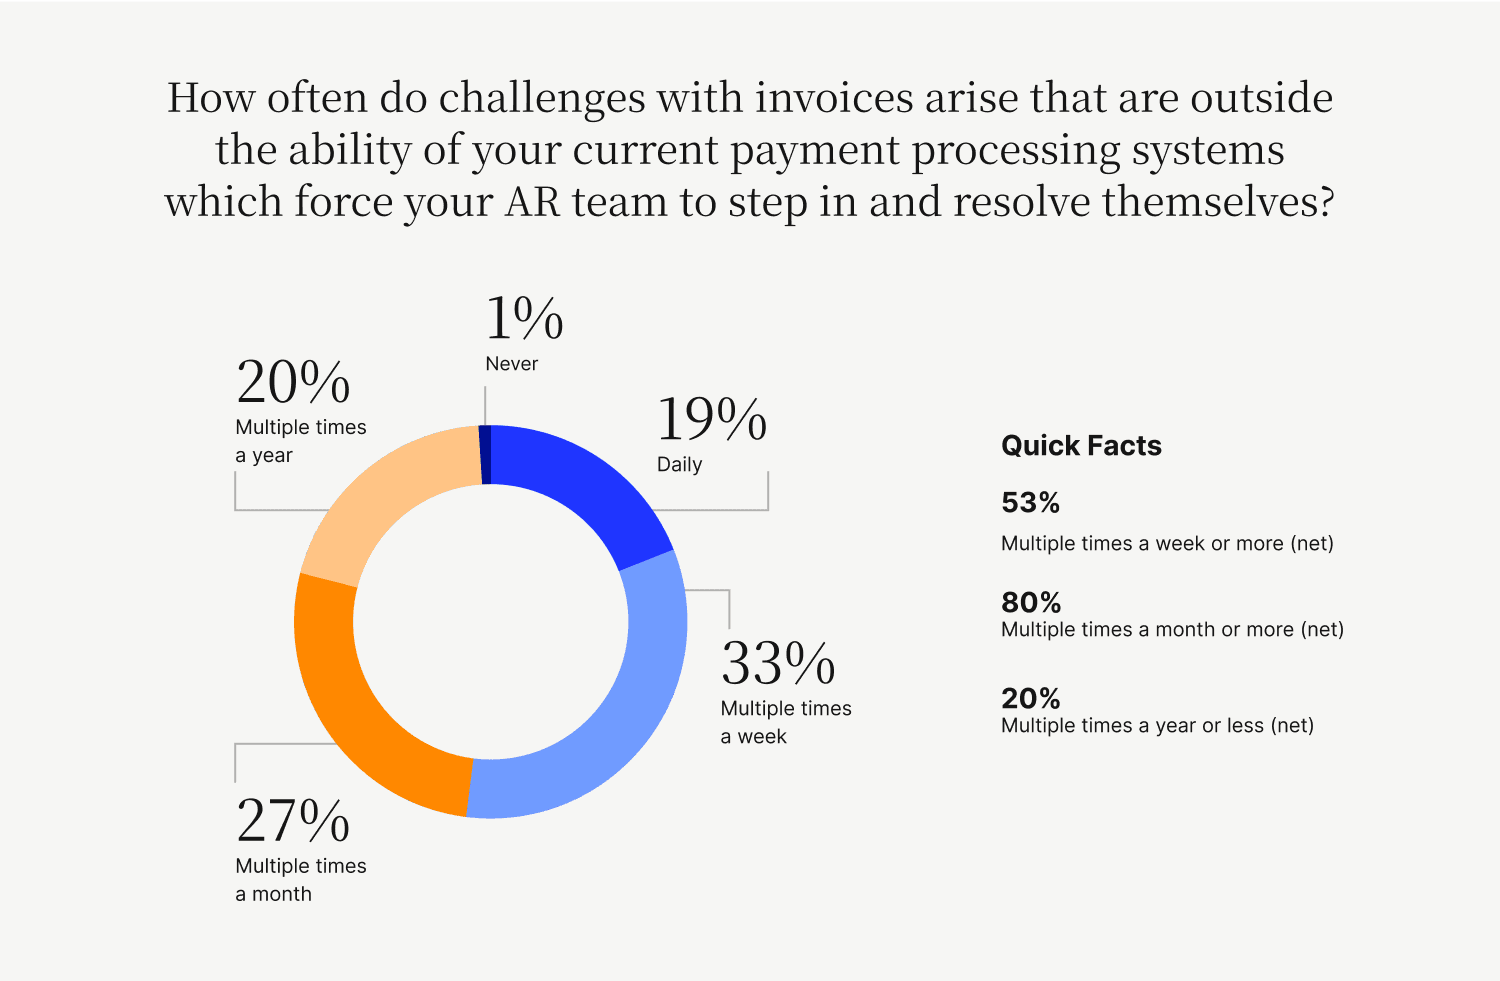
- Four fifths of CFOs report that multiple times a month or more challenges with invoices arise that are outside the ability of their current payment processing systems which force their accounts receivable teams to step in and resolve themselves.
- 19.33% — Daily
- 33.33% — Multiple times a week
- 27.33% — Multiple times a month
- 19.67% — Multiple times a year
- 0.33% — Never
- 80% — Multiple times a month or more (net)
- 52.67% — Multiple times a week or more (net)
- 20% — Multiple times a year or less (net)
- Businesses without collaborative payment portals are forced to manually resolve challenges on nearly $3.7 million worth of invoices monthly
- How we figured this out: Based on the average monthly invoice amounts cited ($6,073.00 excluding outliers), the average monthly invoice volumes cited (2,433 excluding outliers), and the percent of invoices that accounts receivable teams without collaborative payment portals must resolve themselves daily (25%), we estimate mid- to upper-midsized companies are forced to manually resolve challenges on $121,443.36 worth of invoices daily—or $3,693,902.25 monthly.
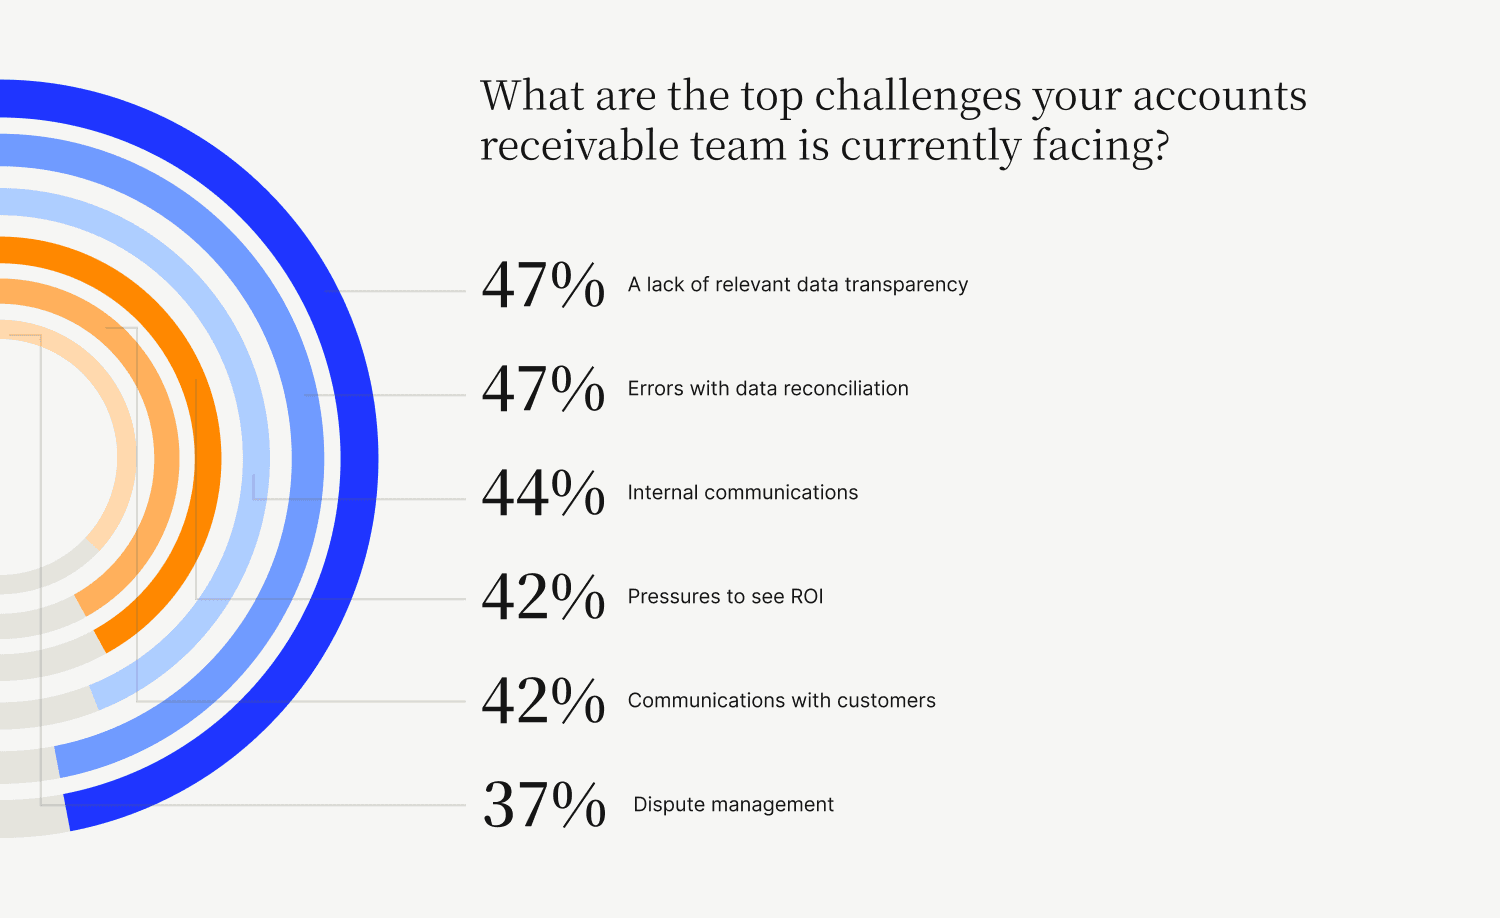
- CFOs face a variety of pressing invoice processing challenges, many of which are best resolved using collaborative payment portals. Here are the top challenges they must deal with.
- 47% (of CFOs) — A lack of relevant data transparency
- 47% — Errors with data reconciliation
- 44% — Internal communications
- 42% — Pressures to see ROI
- 42% — Communications with customers
- 37% — Dispute management
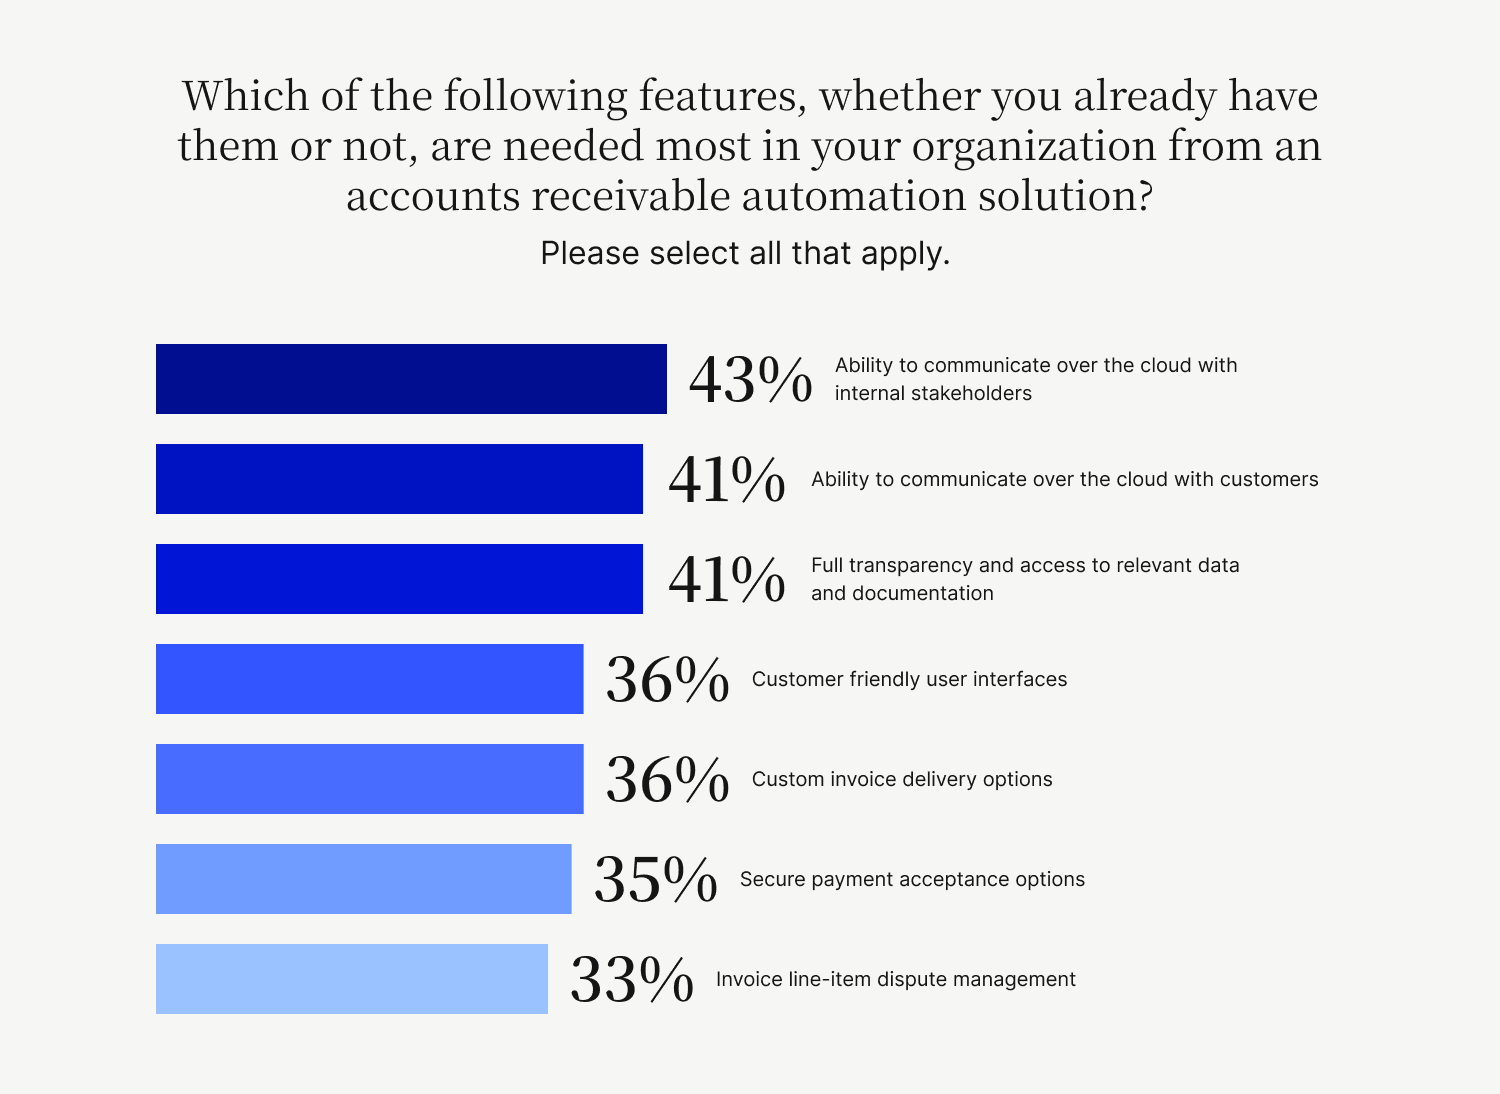
- Collaborative accounts receivable payment portals deliver exactly what CFOs want most from their AR automation solutions. Here are those features CFOs want most.
- 43% (of CFOs) — Ability to communicate over the cloud with internal stakeholders
- 41% — Ability to communicate over the cloud with customers
- 41% — Full transparency and access to relevant data and documentation
- 36% — A customer-friendly user interface
- 36% — Custom invoice delivery options
- 35% — Secure payment acceptance options
- 33% — Invoice line-item dispute management capabilities
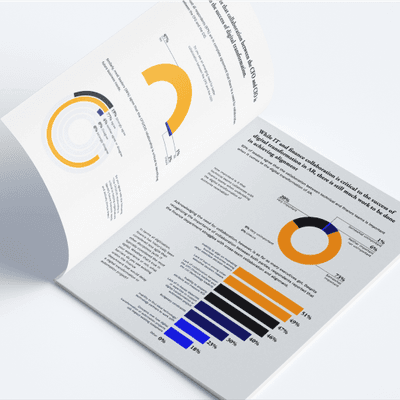
- CFOs’ biggest hurdle is resistance to change.
- How we figured this out: Nearly half of CFOs (43%) cite email as the leading method of contact to resolve invoice errors; followed by phone (22%) and re-printing and mailing invoices (21%). Only 14% of CFOs are utilizing the cloud; the others are stuck using outdated, antiquated communication channels, not seeing any clear path forward.
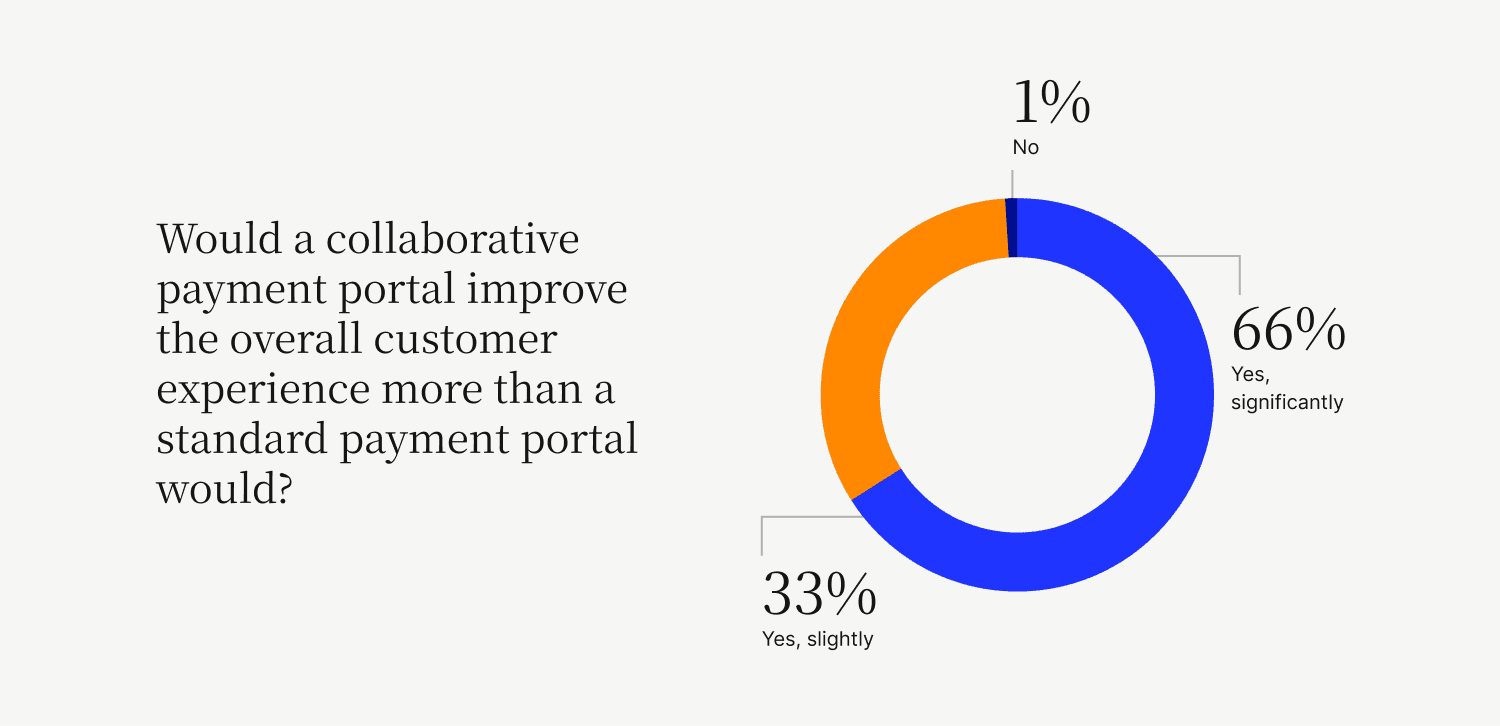
- Nearly all CFOs believe a collaborative accounts receivable payment portal would improve the overall customer experience (to any extent) more than a standard payment portal would.
- 65.67% — Yes, significantly
- 33% — Yes, slightly
- 1.33% — No
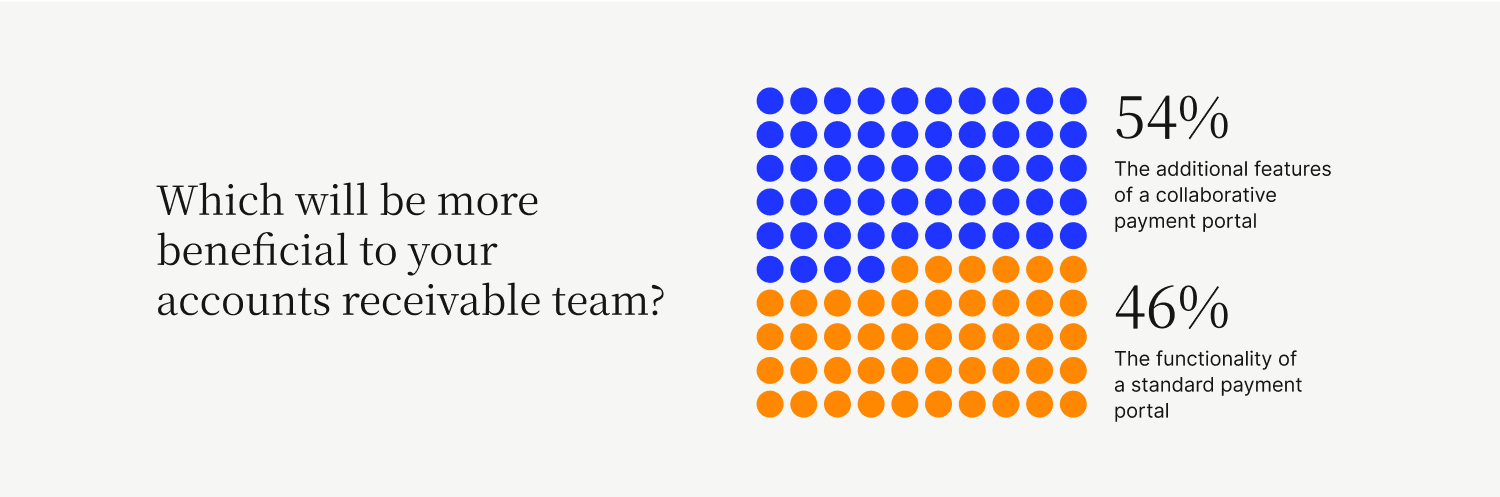
- Over half of CFOs (53.67%) believe the additional features of a collaborative payment portal would be more beneficial to their accounts receivable teams than the functionality of a standard payment portal would (46.33%)
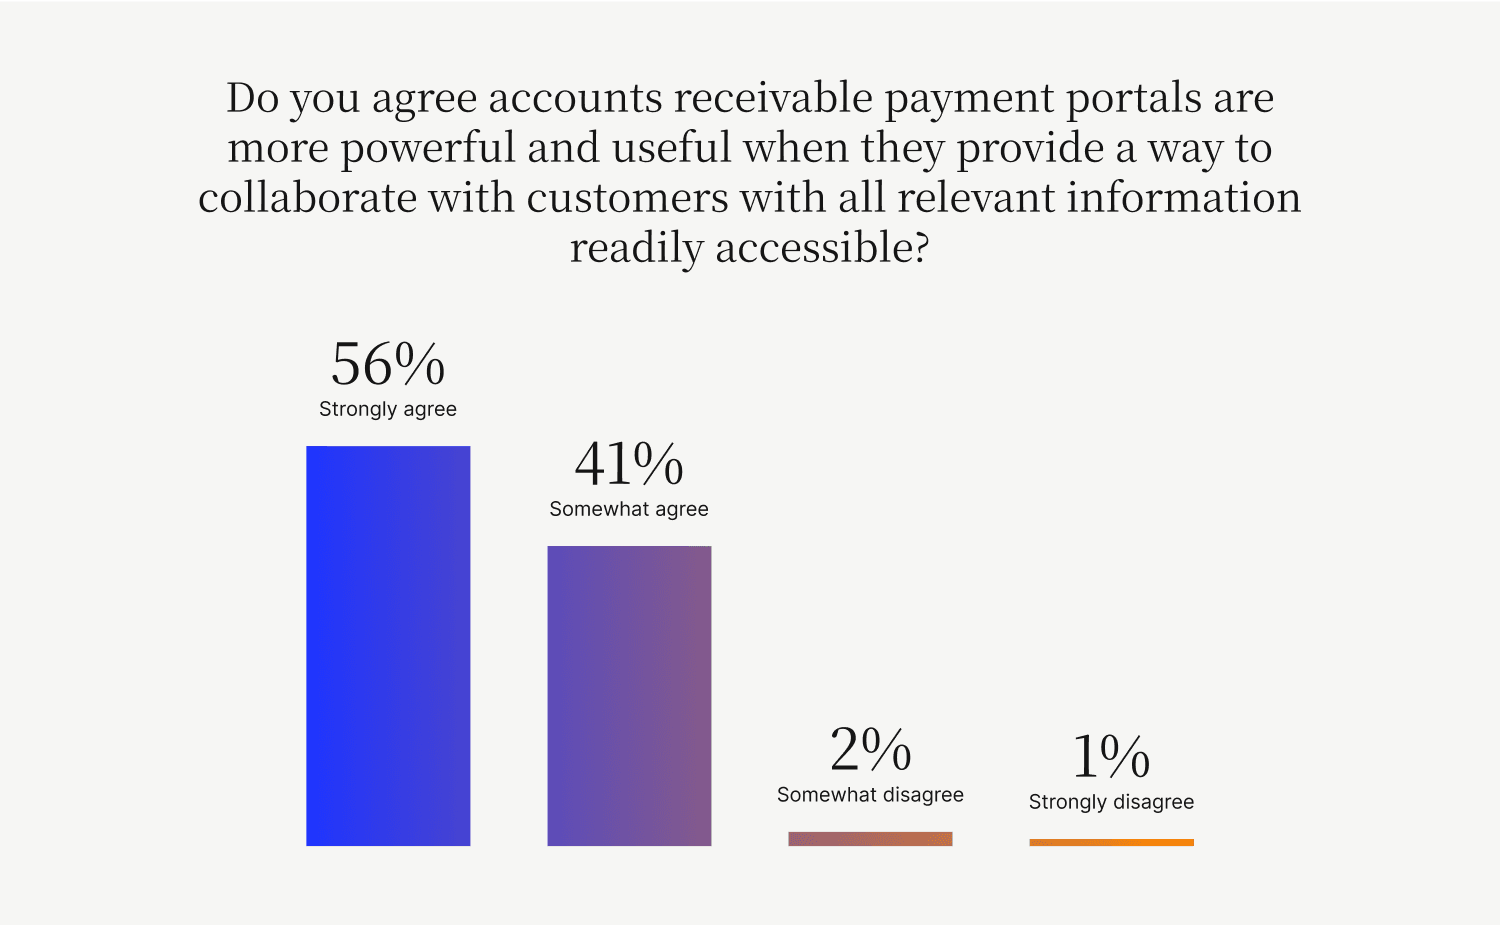
- Nearly all CFOs agree that accounts receivable payment portals are more powerful and useful (to any extent) when they provide a way to collaborate with customers with all relevant information readily available.
- 56% — Strongly agree
- 41.67% — Somewhat agree
- 1.67% — Somewhat disagree
- 0.67% — Strongly disagree
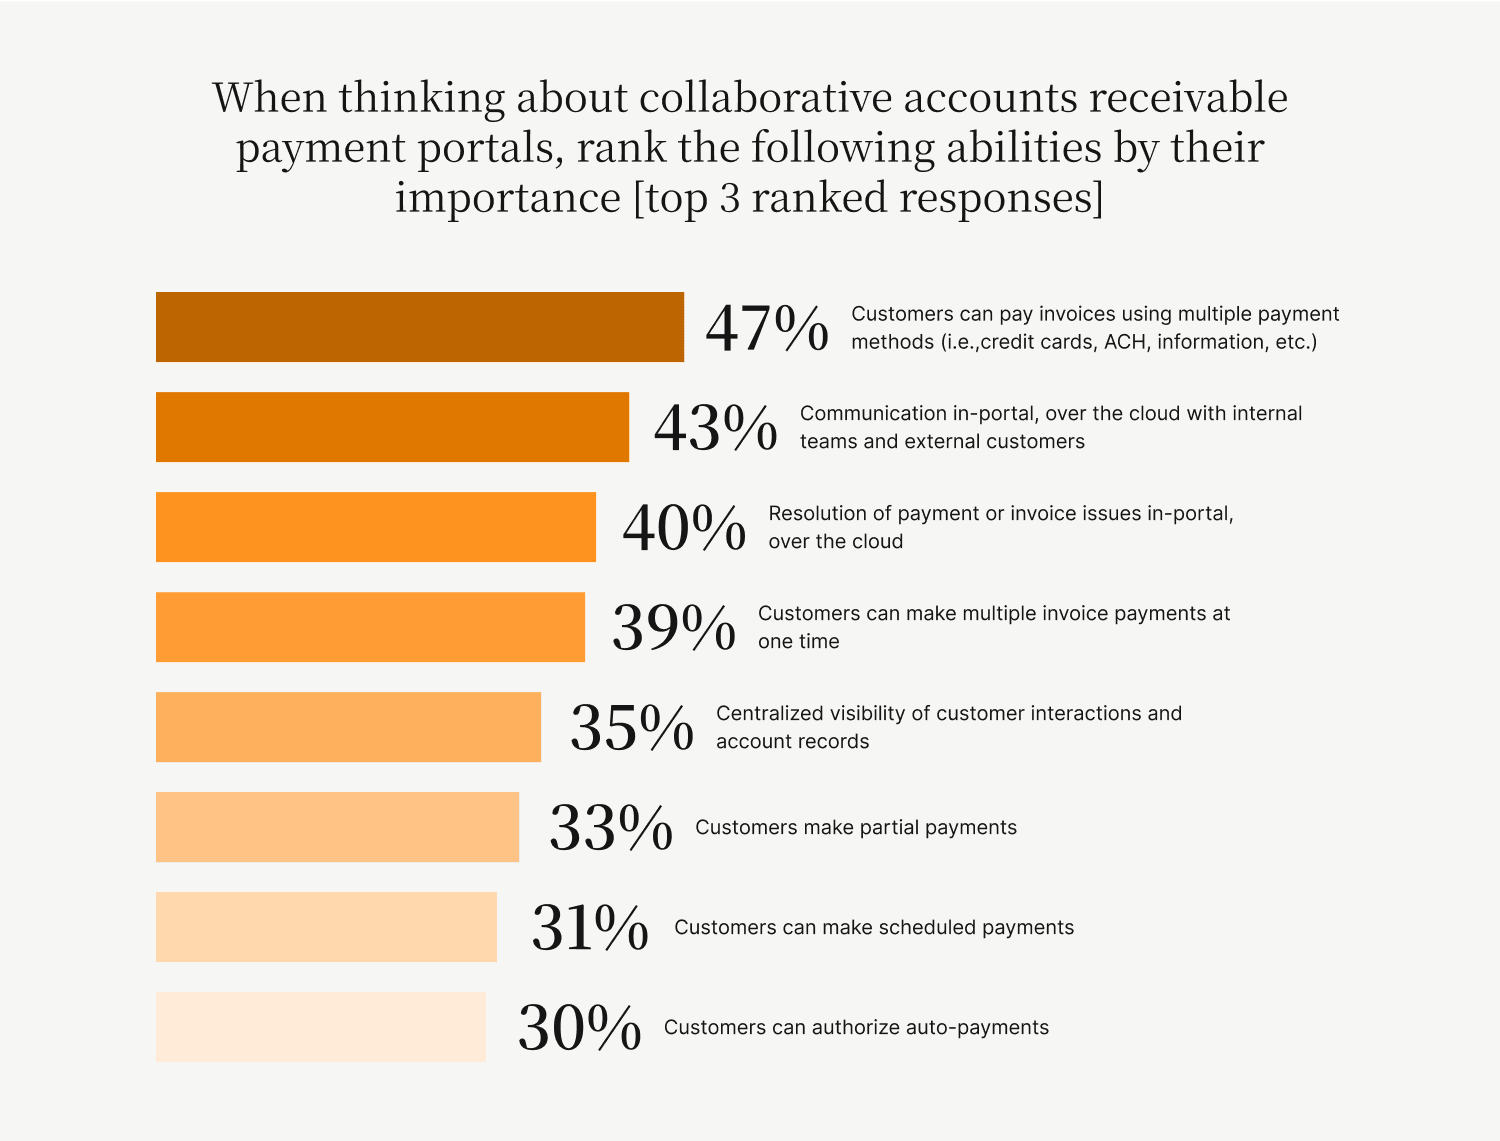
- When thinking about collaborative accounts receivable payment portals, these are the abilities CFOs consider most important [top three ranked responses].
- 47% (of CFOs) — Customers can pay invoices using multiple payment methods (i.e., credit cards, ACH, etc.)
- 43% — Communication in-portal, over the cloud with internal teams and external customers
- 40% — Resolution of payment or invoice issues in-portal, over the cloud
- 39% — Customers can make multiple invoice payments at one time
- 35% — Centralized visibility of customer interactions and account records
- 33% — Customers can make partial payments
- 31% — Customers can schedule payments
- 30% — Customers can authorize auto-payments
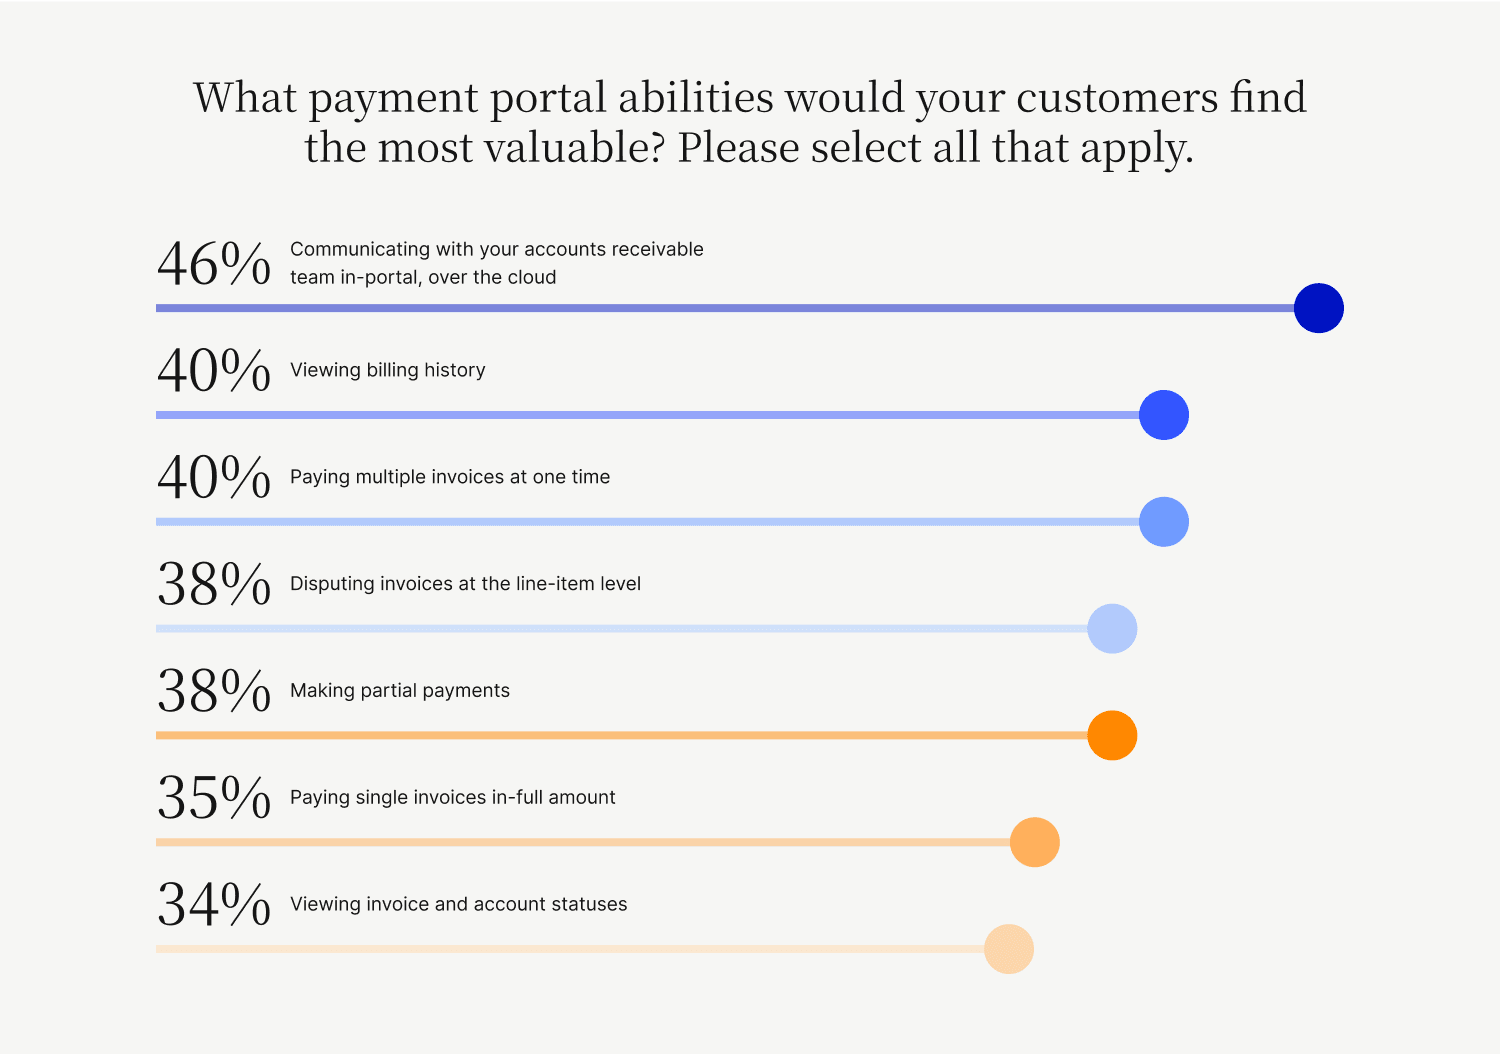
- When thinking about collaborative accounts receivable payment portals, these are the abilities CFOs think their customers would find the most valuable [top three ranked responses].
- 45.67% — Communicating with their accounts receivable team in-portal, over the cloud
- 40.33% — Viewing billing history
- 39.67% — Paying multiple invoices at one time
- 37.67% — Disputing invoices at the line-item level
- 37.67% — Making partial payments
- 34.67% — Paying single invoices in full amount
- 33.67% — Viewing invoice and account statuses
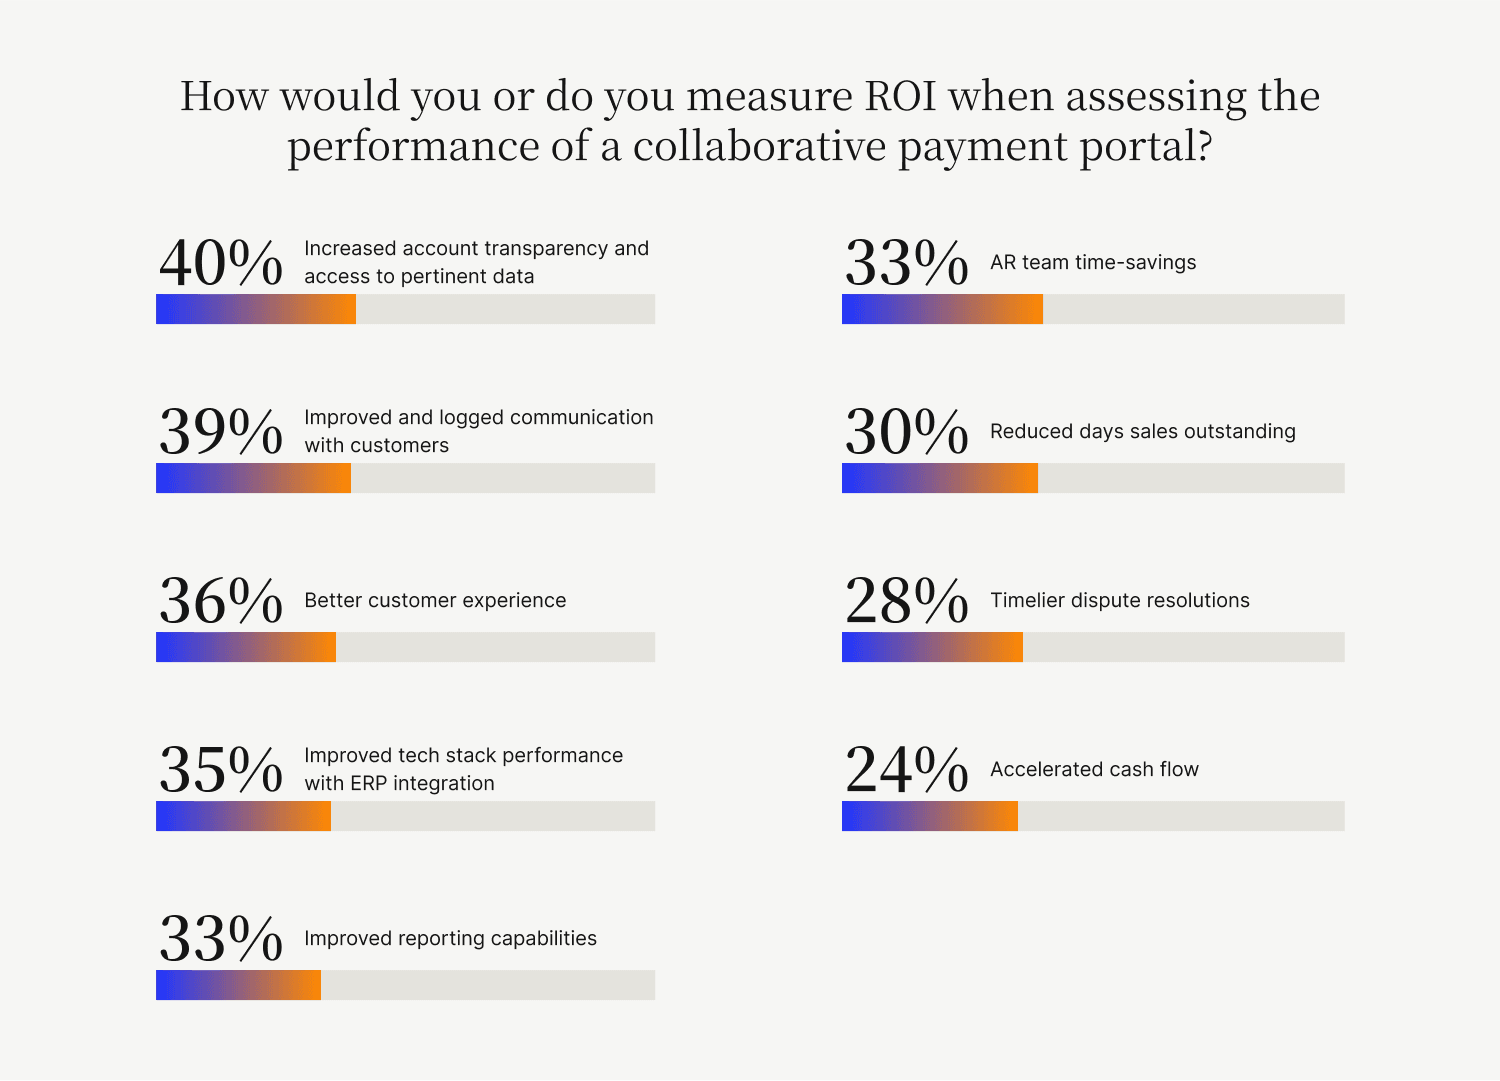
- Here are the standards by which CFOs measure the ROI of collaborative accounts receivable payment portals.
- 40% (of CFOs) — Increase account transparency and access to pertinent data
- 39% — Improve and log communication with customers
- 36% — Improve customer experience
- 35% — Improve their tech stack performance—by virtue of integrating with their ERP
- 33% — Improve their accounts receivable teams’ reporting capabilities
- 33% — Deliver accounts receivable team time-savings
- 30% — Reduce days sales outstanding
- 28% — Resolve disputes in a timelier manner
- 24% — Accelerate cash flow
- Accounts receivable teams with collaborative payment portals are absolved from having to manually resolve over $1.6 million worth of invoices monthly
- How we figured this out: Mid- to upper-midsized companies without collaborative accounts receivable payment portals are forced to manually resolve challenges on $3,693,902.25 worth of invoices monthly. Seeing as those with collaborative payment portals experience daily challenges arising with invoices that are outside of the ability of their current payment processing system to resolve less frequently (14%, compared to 25%), we estimate that this cohort benefits from the time-savings granted by not having to manually resolve $1,625,316.99 worth of invoices monthly.
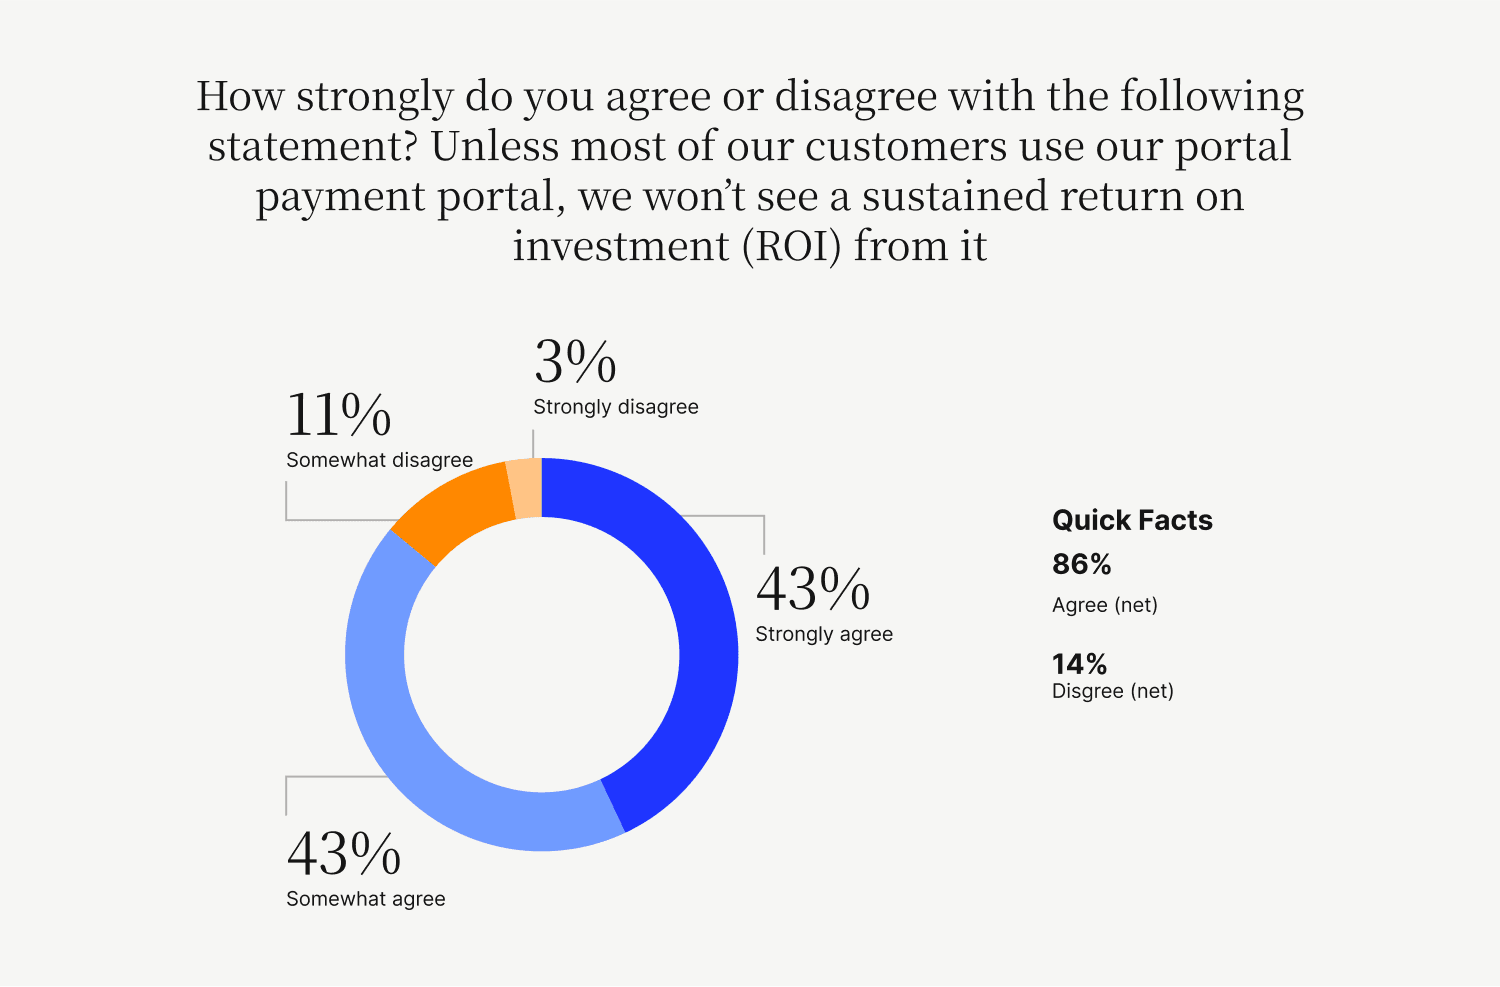
- Over four fifths of CFOs agree that unless most of their customers are using their payment portal, they won’t see a sustained ROI from it.
- 43% — Strongly agree
- 42.67% — Somewhat agree
- 10.67% — Somewhat disagree
- 3.33% — Strongly disagree
The Path to Better Invoice Processing
All Versapay studies
Building Better Customer Relationships
We surveyed 400 finance and business leaders to understand what business relations with customers looks like, which departments must boost their CX efforts, and whether digitization is a feasible solution.
The Path to Better Invoice Processing
Invoice processing is a mission-critical function for businesses, yet it remains a formidable—and often consequential—challenge for most.
Get the free report to see why collaborative accounts receivable payment portals are the best solution for fixing your invoicing woes.
Determine the potential financial impact of Versapay Cash Application on your organization.
The Total Economic Impact™ Of Versapay Cash Application

Are you ready to accept virtual credit cards?
This study will show you why virtual cards are becoming increasingly critical and how you can turn them into a competitive advantage.