
The Data Dilemma: 11 Accounts Receivable KPIs For Your AR Team to Prioritize
- 23 min read
In this in-depth guide, we cover 11 of the best accounts receivable KPIs to use when measuring AR performance. Some you might already use every day and others you might have never thought to measure.

If cash is the fuel of your business, then your accounts receivable (AR) team are the ones stoking the flames. To maximize accounts receivable performance, it’s essential that your AR team has a clear view into how the business is tracking on its collections and where there’s room for improvement. To do this, you need access to the right data and analytics—and more importantly, you need to know what to do with it.
No single key performance indicator (KPI) or metric will tell you the full story of how your collections efforts are performing. That’s why it’s beneficial to actively track several AR KPIs. Having this data readily available will help you identify the strengths and weaknesses within your AR processes so you can make informed decisions that drive your business forward.
In this blog, we’ll cover the 11 most important accounts receivable KPIs to track.
Click to jump to a section:
- AR turnover ratio
- Expected cash collections
- Average collection period
- Days sales outstanding
- Collection effectiveness index
- Average days delinquent
- Number of revised invoices
- Bad debt
- Percentage of high-risk accounts
- Staff productivity
- Customer satisfaction
The 11 most important accounts receivable KPIs to track
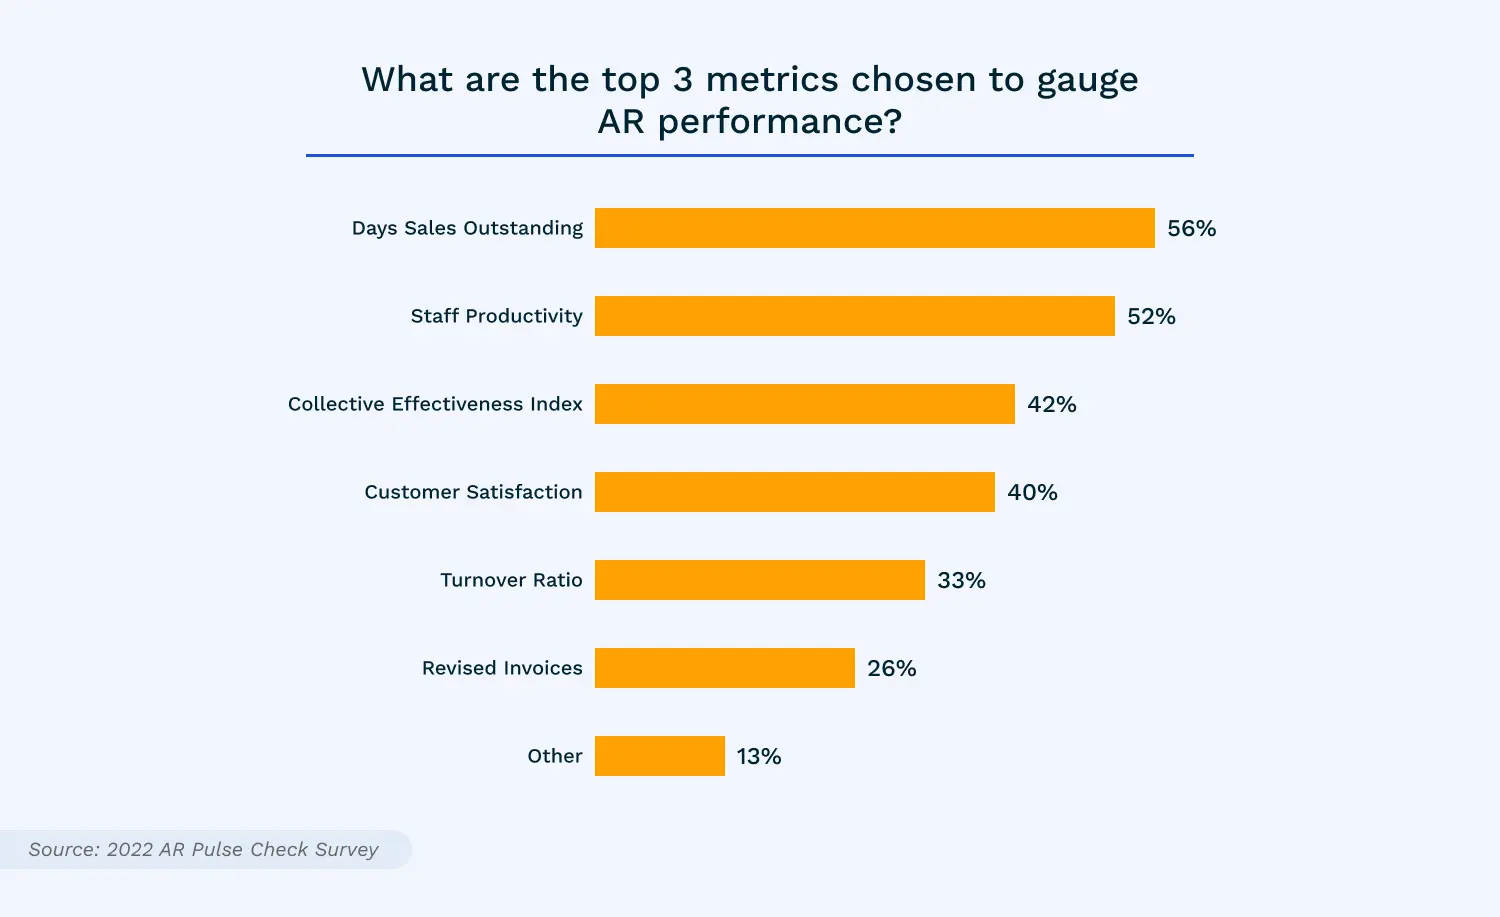
We recently surveyed—in partnership with SSON—103 Shared Services and Outsourcing (SSO), Global Business Services (GBS), and Finance leaders. Respondents were asked which accounts receivable metrics they prioritized for gauging AR performance. While their answers varied, respondents made it clear that maximizing AR performance requires a combination of elite efficiency, productivity, and customer service.
We’ll explain each of these AR KPIs that survey respondents prioritized, along with a few others.
KPI 1: AR turnover ratio
What is AR turnover ratio?
Accounts receivable turnover ratio is a measure of how good your company is at collecting from its customers. It tells you the number of times during a given period (for instance, a month, quarter, or year) the company collected the average value of its receivables.
A higher number is preferable for AR turnover, as it indicates that your company is collecting on outstanding invoices quickly (the company collected on its average receivables more times in a given period).
How do you calculate AR turnover ratio?
The formula for AR turnover ratio looks like this:
- Accounts Receivable Turnover Ratio = Net Credit Sales ÷ Average Accounts Receivable

To calculate your receivables turnover ratio, you’ll of course need to know what your net credit sales (the total number of sales you made to customers on credit terms, accounting for any returns or deductions) and average accounts receivable are for that given period.
Here’s how you can calculate those:
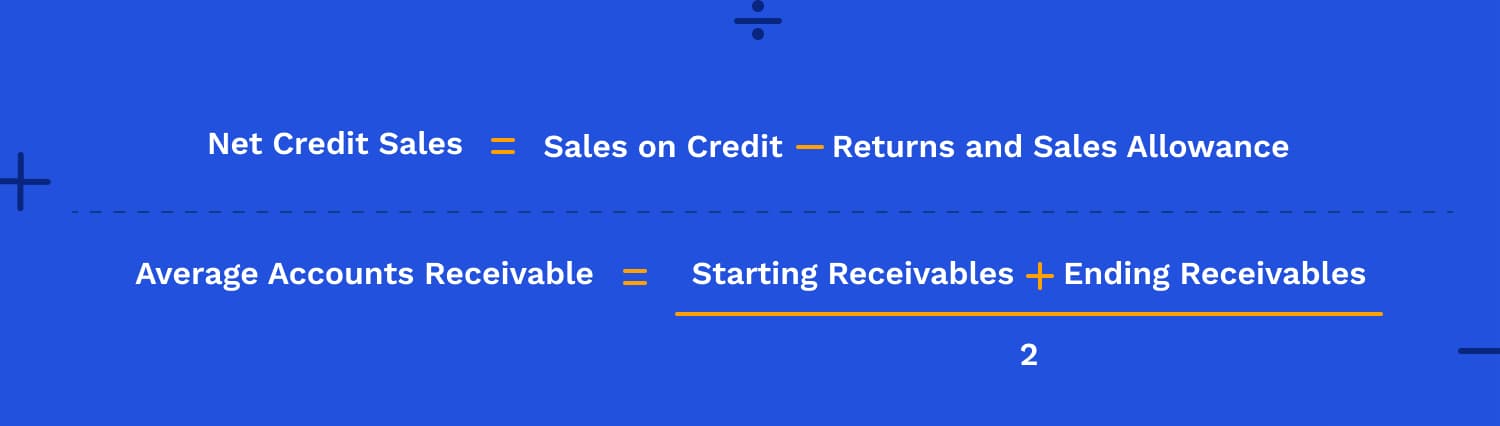
- Net Credit Sales = Sales on Credit – Returns and Sales Allowances
- Average Accounts Receivable = (Starting Receivables + Ending Receivables) ÷ 2
AR turnover ratio example
Let’s imagine your company’s annual credit sales are $90 million and your average accounts receivable for the year were $12 million.
After plugging these values into our AR turnover formula, this would give us an output of 7.5 (90 ÷ 12 = 7.5).
That means within this period (a year), you collected your average receivables 7.5 times. You can use this to approximate how long it takes your customers to pay you on average, which in this case would be about 49 days (365 days ÷ 7.5 = 48.6).
Why is AR turnover ratio important to track?
Companies need to be wise about who they’re extending credit to. The accounts receivable turnover ratio gives them a quick insight into whether they’re extending credit to the right people, and whether their collections team is doing a good job at pursuing overdue receivables.
KPI 2: Expected cash collections
What is expected cash collections?
Expected cash collections refers to the amount of cash a company can reasonably expect to have at a given time. There are two revenue sources that feed into this: your cash sales (where customers pay you right away) and your collections on accounts receivable (where customers pay you on credit).
How do you calculate expected cash collections?
To calculate your total expected cash collections, you’ll add the revenue you anticipate will come from cash sales to the revenue you anticipate will come from accounts receivable:
- Expected Cash Collections = Cash Sales + Projected Collections from Accounts Receivable

You can base your estimated cash sales on trends from previous years. But how do you go about forecasting which of your receivables you confidently expect to collect?
You can:
- Run an AR aging report
- Start by deducting any receivables you know are likely to be uncollectible (we’re talking well over 90 days past-due)
- For each of your receivables aging buckets (1 to 30 days past-due, 31 to 60 days past-due, 61 to 90 days past-due, and over 90 days past-due), estimate what percentage of those receivables you typically collect
- Once you have an estimated collection rate for each aging bucket, multiply that by the current receivables balance you have for each group
Expected cash collections example
Let’s say your company expects to collect:
- 99.5% of your receivables that are 1 to 30 days old (0.5% probability of default)
- 95% of your receivables that are 31 to 60 days old (5% probability of default)
- 92% of your receivables that are 61 to 90 days old (8% probability of default), and
- 85% of your receivables that are over 90 days old (15% probability of default)
Now, let’s say your business has the following dollar amounts in outstanding receivables:
- $594,336 in receivables aged 1–30 days
- $210,126 in receivables aged 31–60 days
- $63,370 in receivables aged 61–90 days
- $56,943 in receivables aged over 90 days
Assuming the rate of collections we mentioned earlier, you could estimate you’ll collect the following amounts:
- $591,364 (0.995 × $594,336)
- $199,620 (0.95 × $210,126)
- $58,300 (0.92 × $63,370)
- $48,402 (0.85 × $56,843)
Now imagine your company’s expected annual cash sales are $110,000. If we total the above forecasted collections from accounts receivable and add it to your expected cash sales, then your total expected cash collections would be $1,007,686 ($110,000 + $897,686).
Why is expected cash collections important to track?
Calculating your expected cash collections can help you better understand your current cash position and take necessary action early if you expect to be short on cash.
KPI 3: Average collection period
What is average collection period?
Average collection period refers to the number of days it takes your business on average to get paid after making a sale or delivering a service. You may also know this metric as days sales outstanding (DSO).
A low average collection period is ideal, as it means your AR team is collecting on outstanding receivables efficiently.
How do you calculate average collection period?
There are two ways you can calculate your average collection period:
- Option 1: Average Collection Period = 365 Days ÷ Accounts Receivable Turnover Ratio
- Option 2: Average Collection Period = (Average Accounts Receivable ÷ Total Net Credit Sales) × 365 Days

Average collection period example
Let’s say your company’s annual credit sales are $25 million and your current receivables total $3.5 million. These values would plug into our formula like this.
- 365 ÷ (25 ÷ 3.5) = 51.1, OR
- (3.5 ÷ 25) × 365 = 51.1
That means on average, it takes the company about 51 days to collect on receivables.
Why is average collection period important to track?
Your average collection period can help you understand many aspects of your business, the most immediate being your cash flow. If your average collection period is higher than you would like, this may signal challenges in unlocking working capital and make it difficult for the business to meet its financial obligations.
KPI 4: Days sales outstanding (DSO)
What is DSO?
Days sales outstanding (also known as average collection period or days receivables) refers to the average number of days it takes for a company to get paid after making a sale on credit.
A low DSO number means it takes your company a reasonably short time to collect from customers, whereas a high DSO number means it takes your company longer to collect from customers.
How do you calculate DSO?

To calculate your DSO for a given period (a single month for instance), you’ll need to know your total receivables and net credit sales for that period.
- (Net Credit Sales = Sales on Credit – Returns and Sales Allowances).
*Note that here we’re only interested in sales made on credit and not cash sales. It’s assumed that sales made on cash are collected upfront and have a DSO of 0 as a result.
Once you have these values, the formula to calculate DSO looks like this:
- DSO = (Accounts Receivable ÷ Total Net Credit Sales) × Number of Days in Period
DSO example
For businesses with seasonal sales or sales that fluctuate month-over-month, calculating your DSO over the course of a quarter instead of a month is a great way to normalize the data to see trends over time.
Let’s say you were calculating the company’s DSO for the first quarter of the year—January to March.
Now, let’s say your company had the following values:
- $80,000 in total net credit sales from January to March
- $45,000 in total accounts receivable over that same period
These values would plug into our formula like this:
- ($45,000 ÷ $80,000) × 90 days = 51
That means, it takes your business on average 51 days to collect receivables. In general, a DSO value below 45 days is considered good. But since DSO ranges vastly from industry to industry, it’s a good idea to see what’s “normal” for your area of business to put things into perspective.
Why is DSO important to track?
Knowing how long it takes your company on average to receive customer payments will help you get a grasp of the status of your cash flow. Plus, not only can DSO tell you more about the effectiveness of your collections team, but it can also give you insight into customer creditworthiness and satisfaction.

KPI 5: Collection effectiveness index (CEI)
What is the collection effectiveness index?
The collection effectiveness index (CEI) refers to the percentage of its receivables a company has collected during a given period. Like the name suggests, this AR metric gives you an insight into how effective your company is at collecting its receivables. A high CEI is ideal, as it means you’ve successfully collected a higher proportion of your receivables.
CEI offers a different perspective for gauging the success of your collections efforts than DSO or average collection period. Whereas DSO measures success based on how fast you’re able to collect receivables, CEI measures success based on having as few uncollectible receivables as possible. One is a measurement of time while the other is a measurement of quality.
How do you calculate collection effectiveness index?
The formula for calculating collection effectiveness index looks like this:
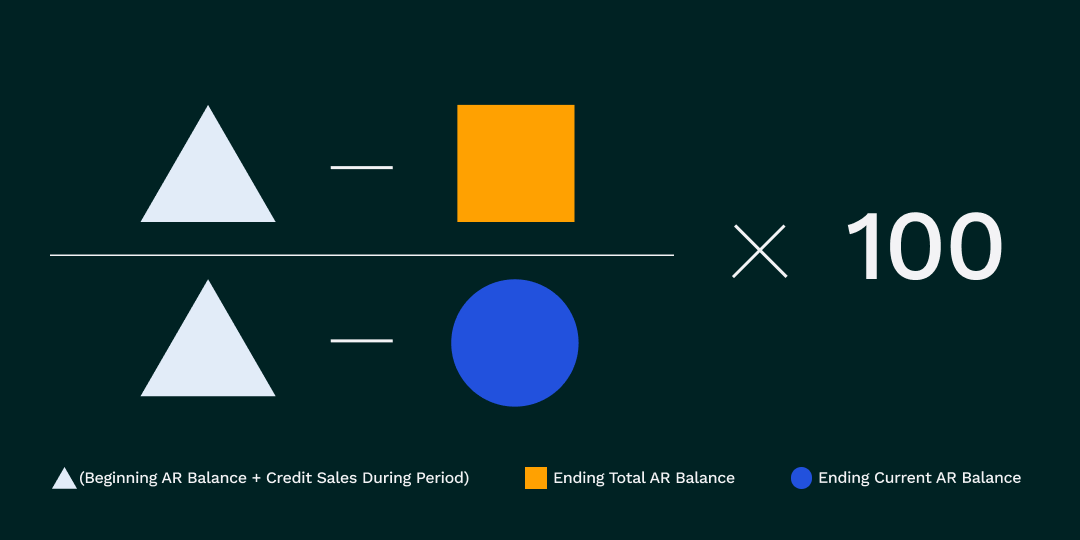
- Collection Effectiveness Index = [(Beginning AR Balance + Credit Sales During Period) – Ending Total AR Balance] ÷ [(Beginning AR Balance + Credit Sales During Period) – Ending Current AR Balance] x 100
Here’s what each of the inputs mean:
- Beginning receivables: the amount in outstanding AR the company has at the start of the period in question
- Credit sales during period: the total sales made on credit during the period in question
- Ending total receivables: the amount in outstanding AR at the end of the period in question
- Ending current receivables: the total of all payments received for credit sales made during the period in question
Collection effectiveness index example
Let’s imagine your AR team wants to calculate the company’s collections effectiveness index over the course of a particular month and has the following values:
- Beginning AR balance: $120,000
- Monthly credit sales: $30,000
- Ending total AR balance: $55,000
- Ending current AR balance: $10,000
Those numbers would plug into our equation like this:
- [($120,000 + $30,000) – $55,000] ÷ [$120,000 + $30,000) – $10,000] × 100 = 68%
Ideally, you want a collection effectiveness index as close to 100% as possible, though achieving this is not realistic in most situations. Generally, a collection effectiveness index of 80% or above is considered “good.”
Why is collection effectiveness index important to track?
Examining your CEI output can help you determine if there are any snags in your invoice-to-cash process preventing you from getting paid. If your collections efforts are 68% effective as in the example above (a letter grade of D), then it signals to your AR team that there’s a problem in need of calibrating.
KPI 6: Average days delinquent (ADD)
What is average days delinquent?
Average days delinquent (ADD)—sometimes referenced as delinquent days sales outstanding—refers to the average number of days your invoices are delinquent or past-due.
A higher ADD indicates that your customers are generally slow to pay. Conversely, a lower ADD indicates your customers pay you generally quickly.
Like with many of the other accounts receivable KPIs we cover here, however, a high or low output is subjective and should be interpreted in the context of how your competitors and others in the industry are performing.
How do you calculate average days delinquent?
To calculate average days delinquent, you must first calculate the following:
- DSO = (Accounts Receivable ÷ Total Net Credit Sales) x Number of Days in Period
- Best Possible DSO (BPDSO) = (Current Accounts Receivable ÷ Total Net Credit Sales) x Number of Days in Period
Once you have those values, you can calculate ADD with this formula:
- Average Days Delinquent = DSO – BPDSO

Average days delinquent example
Let’s say your business is making $80,000 in total net credit sales from January to March (90 days). Now, let’s say that over that same period, your total accounts receivable is $45,000.
Your DSO over the course of that period would be around 51 days ([45,000 ÷ 80,000] × 90 days = 51).
Now, let’s imagine your current accounts receivable (your receivables that are not yet overdue) amount to $15,000.
Your BPDSO would then be about 17 days ([15,000 ÷ 80,000] × 90 = 16.9)
These values would plug into our equation for ADD like this:
- 51 – 17 = 34
In this case, your average days delinquent would be 34.
Why is average days delinquent important to track?
Credit and collections teams often evaluate days sales outstanding, best possible days sales outstanding, and average days delinquent simultaneously to better understand how fast they’re able to convert invoices into cash.
Note that your DSO and ADD may or may not have similar trends. For example, an improvement in DSO could be reflective of modified credit terms you recently implemented or a shortened AR cycle. If ADD is simultaneously going up, this could simply be due to a seasonal spike in sales.
To get the full story of what your data tells you, it’s always important to examine trends over time and potential influencing factors.
KPI 7: Number of revised invoices
What is number of revised invoices?
Number of revised invoices refers to the total number of invoices your AR team has had to revise over a particular period.
Your team might revise invoices for any number of reasons, be it a clerical error (such as listing an incorrect number of items) or an administrative adjustment (such as a change in payment terms).
Most often, an invoice is revised due to a customer disputing it. In these cases, the seller might issue a credit memo for billing corrections, which documents the reduced amount the customer owes.
How do you calculate number of revised invoices?
Measuring your company’s number of revised invoices goes beyond looking at how many invoices you’ve had to correct over a specific period.
Issuing invoice revisions has implicit costs like the labor required to facilitate the changes, losses to staff productivity, and delayed payment speed.
For this reason, we recommend taking this metric a few steps further to get a more holistic picture of the impact revised invoices have on your collections process.
Beyond the sheer number of invoices your AR team has corrected, you should also estimate your team’s:
- Average time spent resolving disputes (and the average number of revised invoices because of disputes alone)
- Average time spent creating revised invoices
- Average time for delivery of revised invoices (especially relevant if you’re still sending invoices via mail)
Once you’ve added up all of the above, you’ll likely arrive at a specific number of days. Next, add that value to your average collection period to predict when payment will be received after reissuing an invoice.
Why? Because you'll inevitably have customers that interpret an invoice revision to a resetting of payment term expectations.
Why is number of revised invoices important to track?
Revising just one invoice can take substantial effort because your AR team must spend time investigating the cause of the dispute and evaluate whether you’ll provide a price reduction.
If your number of revised invoices is high, it could point to broader invoicing problems—like frequent errors from manual data entry—that might only be resolved by introducing AR automation.
KPI 8: Bad debt
What is bad debt?
Making sales on credit comes with a certain level of risk. Bad debt, which is when a buyer fails to pay their outstanding debt, is one such risk.
Bad debt is an amount that a business will write off as uncollectible. It’s categorized as an expense on a company’s balance sheet.
How do you calculate bad debt?
There are two ways you can recognize bad debt expense: the direct write-off method and the allowance method.
Under the direct write-off method, a bad debt is marked as an expense as soon as it appears that the amount will be uncollectible. The method is nice and simple because it requires no guessing about how much to expense.
The challenge with this method, however, is that under the Generally Accepted Accounting Principles (GAAP), an expense needs to be recorded in the same period as its corresponding revenue. This means you won’t be able to wait until you know for sure that a debt is uncollectible to write it off.
That’s why most businesses use the allowance method. Businesses use allowance for doubtful accounts to plan for the possibility of receivables being uncollectible before they know the actual value of the bad debt.
There are a few ways you can calculate bad debt through the allowance method:
- Percentage of Sales (to determine what will be added to the ADA balance) = Percentage of Sales Estimated Uncollectible* × Actual Credit Sales
- Percentage of Receivables (to determine the ending ADA balance) = Percentage of Outstanding Receivables Estimated Uncollectible* × Receivables Balance
- Aging Schedule = Percentage of Outstanding Receivables Estimated Uncollectible* × Receivables Balance (for each AR aging bucket, then added all together)
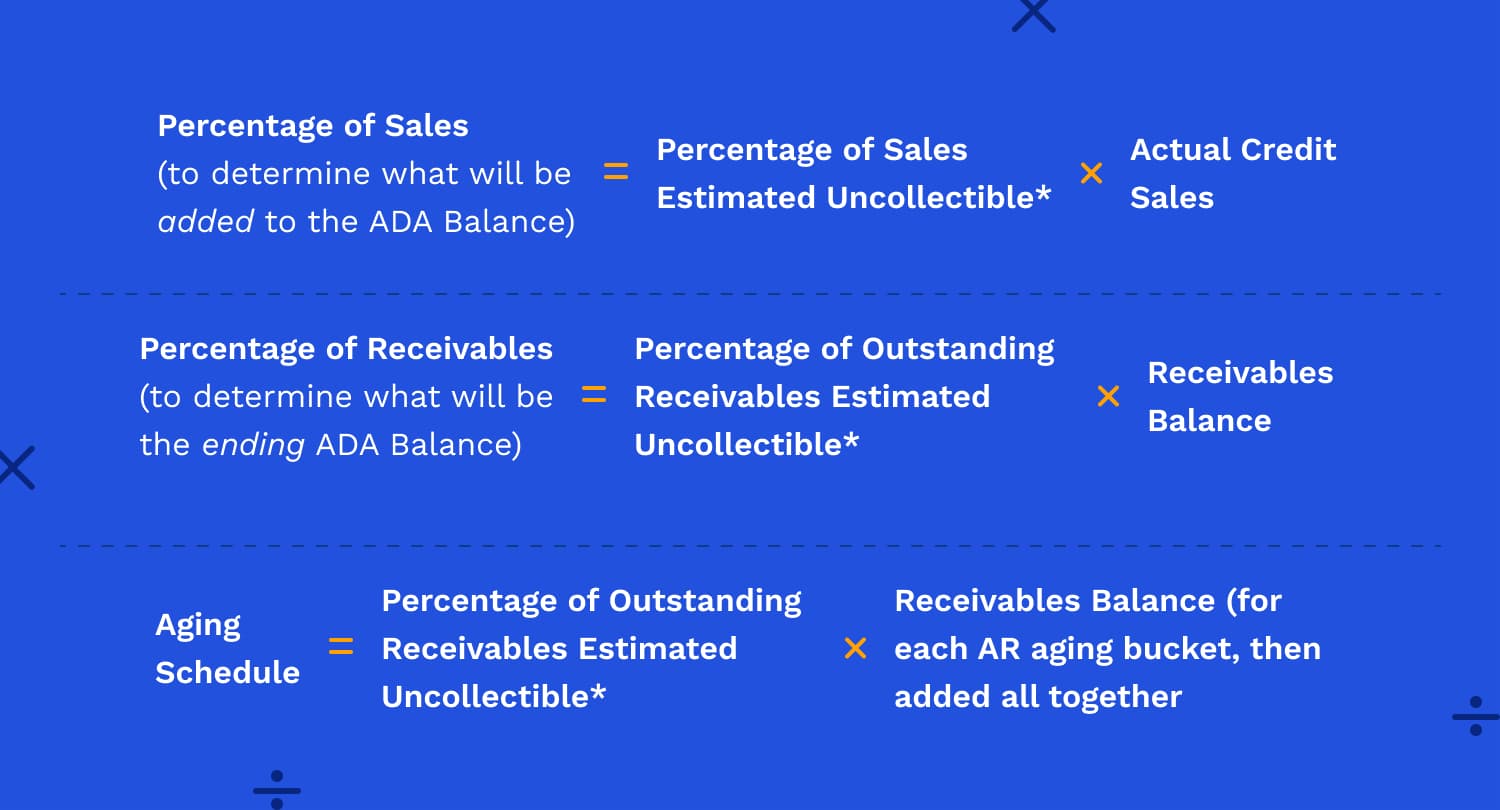
*Based on data from previous years
To find your historical basis of percentage of sales estimated to be uncollectible, you can use bad debt to sales ratio: Bad Debt to Sales Ratio = (Actual Uncollectible Debts ÷ Sales per Period) x 100

Bad debt example (allowance method)
Let’s say you’re using the aging schedule method to calculate your allowance for doubtful accounts, as it provides a slightly more accurate estimate than the other two methods we’ve mentioned above.
After analyzing your business’ finances from the last fiscal year, you found that:
- 2.5% of receivables that were 1 to 30 days old defaulted
- 5% of receivables that were 31 to 60 days old defaulted
- 8% of receivables that were 61 to 90 days old defaulted
- 15% of receivables that were over 90 days old defaulted
Now, let’s assume your business currently has the following dollar amounts in outstanding receivables:
- $6,486,897 in receivables aged 1 to 30 days
- $1,756,194 in receivables aged 31 to 60 days
- $652,503 in receivables aged 61 to 90 days
- $128,337 in receivables aged over 90 days
To estimate how much you’ll need to add to your ADA, you’ll calculate the following:
- 0.025 x $6,486,897 = $162,172
- 0.05 x $1,756,194 = $87,810
- 0.08 x $652,503 = $52,200
- 0.15 x $128,337 = $19,251
Next, you’ll add up your projected uncollectable debts for each aging category. This gives you a result of $321,433. This is your allowance for doubtful accounts.
Why is bad debt important to track?
Forecasting how much bad debt you can expect to have helps you plan and manage your cash flow better.
KPI 9: Percentage of high-risk accounts
What is percentage of high-risk accounts?
Percentage of high-risk accounts looks at the proportion of a business’ customers that might eventually contribute to bad debt.
Doing business with a higher percentage of high-risk customers can make it more difficult to reliably collect payment. Having too low a tolerance for risk, however, might have you at a disadvantage too, as it becomes difficult to grow revenue.
How do you calculate percentage of high-risk accounts?
There is no standardized method of calculating your percentage of high-risk accounts. But, that doesn’t mean you can’t get a picture of which customers are unlikely to pay their debts on time.
The first step to calculating your percentage of high-risk accounts is to define what high-risk means to your specific business. And depending on your appetite for risk, this could vary significantly from business to business.
A general rule of thumb is that the longer a receivable remains unpaid, the higher its risk of becoming uncollectable. On average, it can take companies approximately 37 days to collect payments, however, that will vary depending on your industry.
Here are further steps you can take to build a general risk profile for evaluating customers:
- Determine your—and your industry’s—average collection period. Benchmark both against your industry and competitors if you’re able to surface that data. (Dun & Bradstreet’s quarterly Accounts Receivable and Days Sales Outstanding Industry Report is a good place to start.)
- Conduct customer credit assessments on a regular basis
- Continually evaluate your AR aging report and identify deteriorating payment trends early
- Determine the impact of non-invoice-related costs associated with a customer (such as onboarding fees, training fees, and legal fees)
With this framework in place, you can determine the percentage of your customers that could be deemed high-risk accounts (take the number of customers you deem to be “high-risk”, divide it by your total number of customers, then multiply this by 100).
Why is percentage of high-risk accounts important to track?
Knowing which accounts are high-risk helps you know where to focus your collectors’ attentions in their efforts to prevent bad debt.
It also presents an opportunity for AR teams to strengthen customer relationships and contribute to their business’ overall customer experience objectives.
Rather than write off high-risk accounts right away, interact more purposefully with them. You might just gain a better appreciation for how your customers operate and turn them into more reliable paying clients.
KPI 10: Staff productivity
What is staff productivity in accounts receivable?
There are many ways to gauge staff productivity. For instance, you might measure it based on the time it takes to complete a task or how many workers are required for a project.
The basic principle of productivity is to get the most units of output for your units of input. Ideal efficiency for the accounts receivable department is to maximize output (invoices sent, payments collected, payments applied to their respective invoices) with the lowest possible input (labor, capital, and materials).
How do you calculate staff productivity in accounts receivable?
Calculating productivity is deceptively simple. You can do so by dividing your units of output by your units of input:
- Productivity = Units of Output ÷ Units of Input
Traditional AR processes, however, are marred by high degrees of manual work. Your AR staff might be putting in as much work as they reasonably can, but inefficient processes are slowing down their ability to complete important tasks.
Because of this, it’s more useful to calculate how much time your AR team spends completing tasks manually. You can still calculate your team’s level of output—just know that it won’t mean much if your staff is bogged down by inefficient processes.
Here are two ways you can estimate the degree to which your AR team is constrained by manual work:
- Percentage of Tasks Performed Manually = (Number of Tasks Performed Manually ÷ Total Number of Tasks) x 100
- Percentage of Time Spent Manually Performing AR tasks = (Time Spent Manually Performing Tasks ÷ Hours in a Workday) x 100
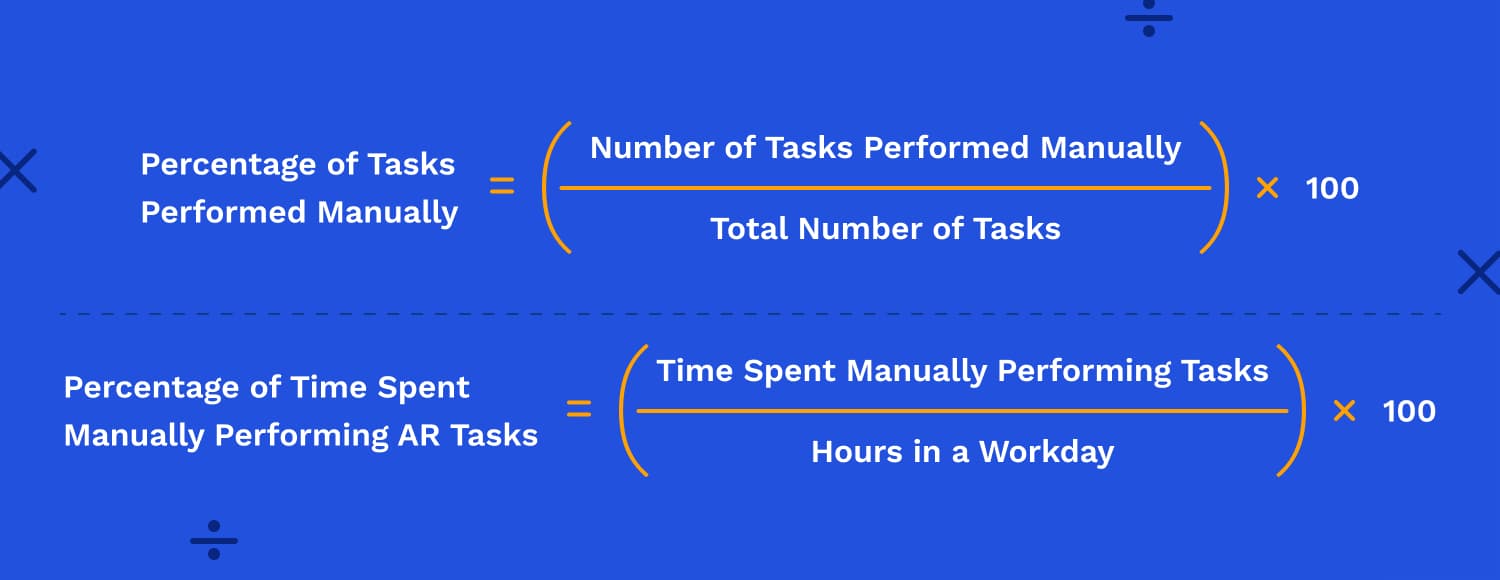
This will provide you with a benchmark when introducing any level of automation into your AR processes, surfacing any gains you’ve made and validating your technology spend.
Why is staff productivity important to track?
Enjoying high levels of productivity in accounts receivable means ensuring your AR staff have the right tools and processes in place to do their jobs efficiently. A rising tide lifts all boats, and this couldn’t be truer in the context of staff productivity. Higher staff productivity also equates to:
- Lower days sales outstanding
- Fewer billing and invoicing errors
- More time to allocate to more strategic work
- Lower employee turnover rates
KPI 11: Customer satisfaction
What is customer satisfaction?
Customer satisfaction is a measure of how happy your customers are with your products, services and capabilities. In accounts receivable, customer satisfaction is a measure of how streamlined and convenient your customers’ billing and payment experience is.
How do you calculate customer satisfaction?
There are a few ways a company might measure customer satisfaction, a primary one being the net promotor score (NPS). NPS is a metric based on how likely a customer is to recommend your company to a peer.
But whereas the NPS looks at the entirety of the customer experience, AR departments want to be able to gauge customer satisfaction within the billing and payment experience alone. There is unfortunately no standardized accounts receivable KPI for this.
But, there are certainly criteria you can look at to arrive at a system of measurement yourself.
In our view, effective customer experience in accounts receivable depends on four things:
- Whether customers can self-service (to make payments and access important information and documents)
- The quality of your AR team’s communication with customers (especially in the context of dispute resolution)
- The level of transparency customers get into the status of their accounts
- The flexibility you offer for invoice delivery and payment methods
Consider giving your company a score (for instance, between one and ten) on each of these four criteria. This will help give you a clearer picture of how satisfied your customers are with the billing and payment experience you provide.
Understanding where barriers to payment exist and prioritizing customers’ experience at every interaction with your AR team will ensure higher levels of customer satisfaction.
Why is customer satisfaction important to track?
The rationale for prioritizing customer experience is simple: happy customers will continue to buy from you and unhappy customers will take their business elsewhere.
The payment process is a particularly vulnerable point in the B2B customer journey, as finds a new Versapay report based on a survey of 1,000 c-level executives. 73% of respondents recognized that their invoice-to-cash cycle was a frequent source of negative customer experiences. 85% also reported that poor communication between AR teams and their customers has led to nonpayment.
By determining how satisfied your customers are with their billing and payment experience, you can see if there are areas where you need to make improvements.
—
Looking for even more insights on accounts receivable metrics? Hear from Versapay's CFO on the AR metrics you should be measuring, how to measure them, and what you can do to make the soar in this on-demand webinar.
Developing a system of reporting that’s right for your unique business
While the metrics we’ve outlined above are some of the most common accounts receivable KPIs used by AR teams, there are of course others out there that a business might use to gauge performance.
You can use any combination of the accounts receivable KPIs we’ve outlined above to stay on top of your company’s cash position—and you certainly don’t have to track all of them. The key is to develop a system of reporting that fits with how your business operates.
For instance, while days sales outstanding is one of the primary metrics used to discuss AR performance (and the most favored by respondents of Versapay and SSON’s AR Pulse Check survey), it doesn’t work for every business. Commercial real estate (CRE) firms don’t make sales; they collect rent. For this reason, AR teams at CRE companies tend to report on different KPIs for accounts receivable.
Versapay combines powerful AR automation with a cloud-based collaborative network, allowing sellers and buyers to collaborate easily on any issue that might hold up payment. Interactive dashboards make it easy to view critical AR performance metrics at a glance, right when you log into the platform. The result? Increased efficiency and accelerated cash flow—with more satisfied customers to boot.
About the author

Nicole Bennett
Nicole Bennett is the Senior Content Marketing Specialist at Versapay. She is passionate about telling compelling stories that drive real-world value for businesses and is a staunch supporter of the Oxford comma. Before joining Versapay, Nicole held various marketing roles in SaaS, financial services, and higher ed.
AR Dashboards, Reporting and Analytics
Identify and interpret the data that really counts.


Always stay up-to-date
Subscribe
Join the 50,000 accounts receivable professionals already getting our insights, best practices, and stories every month.